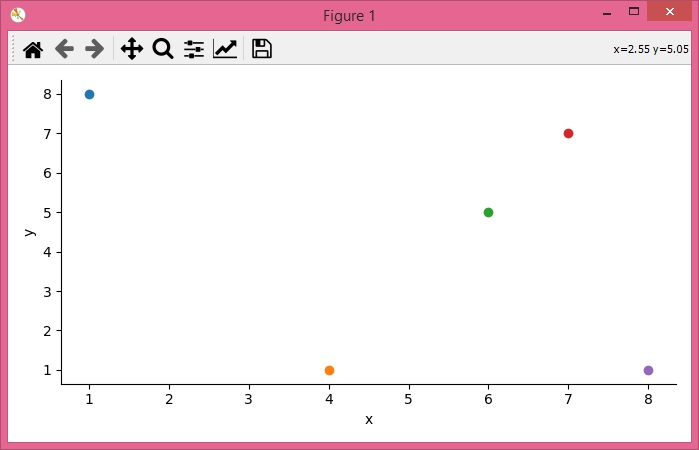
如何使用seaborn创建多组散点图并连接点?
为了使用seaborn创建多组散点图并连接点,我们可以按照以下步骤进行−
步骤
- 设置图像大小并调整子图之间和周围的填充间距。
-
创建一个Pandas数据框,其中包含二维、可变大小、可能异构的表格数据。
-
用于绘制条件关系的多面网格。
-
将绘图函数应用于每个条件子集的数据。
-
使用 x 和 y 数据点绘制散点和数据点。
-
要显示图形,请使用 show() 方法。
示例
import pandas as pd
import seaborn as sns
from matplotlib import pyplot as plt

plt.rcParams["figure.figsize"] = [7.50, 3.50]
plt.rcParams["figure.autolayout"] = True

df = pd.DataFrame({"x": [4, 6, 7, 1, 8], "y": [1, 5, 7, 8, 1]})

g = sns.FacetGrid(df, hue="x", height=3.5)
g.map(plt.scatter, "x", "y")
g.map(plt.plot, "x", "y")

plt.show()
输出
它将产生以下输出−

 极客教程
极客教程