matplotlib.axes.axes.hlines()
matplotlib.axes.axes.hlines()函数,matplotlib库的Axes模块中的Axes.hlines()函数用于绘制从xmin到xmax每个y的垂直线。
语法:
Axes.hlines(self, y, xmin, xmax, colors=’k’, linestyles=’solid’, label=”, *, data=None, **kwargs)
参数:该方法接受如下参数说明:
- y:该参数是绘制直线的y索引序列。
- xmin, xmax:这些参数包含一个数组.,它们表示每行的开始和结束。
- colors:可选参数。它是默认值为k的线条的颜色。
- linetsyle:可选参数。它被用来表示线型{‘ solid ‘, ‘虚线’,’ dashdot ‘, ‘ dot ‘}。
- label:该参数也是一个可选参数.它是情节的标签。
返回:
返回LineCollection。
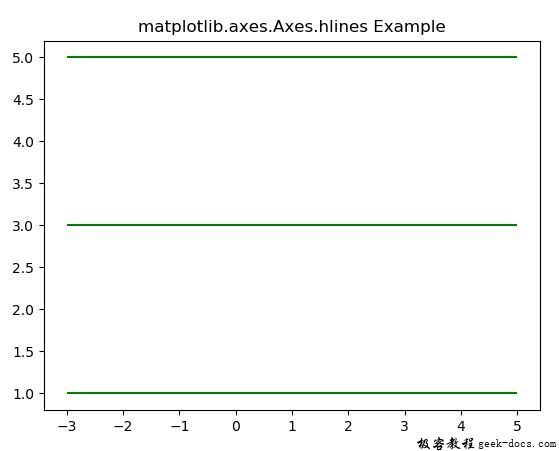
下面的例子演示了matplotlib.axes中的matplotlib.axes.hlines()函数:
示例1
# Implementation of matplotlib function

import numpy as np
from matplotlib import patches
import matplotlib.pyplot as plt

fig, ax = plt.subplots()
ax.hlines([1, 3, 5], -3, 5, color ="green")
ax.set_title('matplotlib.axes.Axes.hlines Example')

plt.show()
输出:

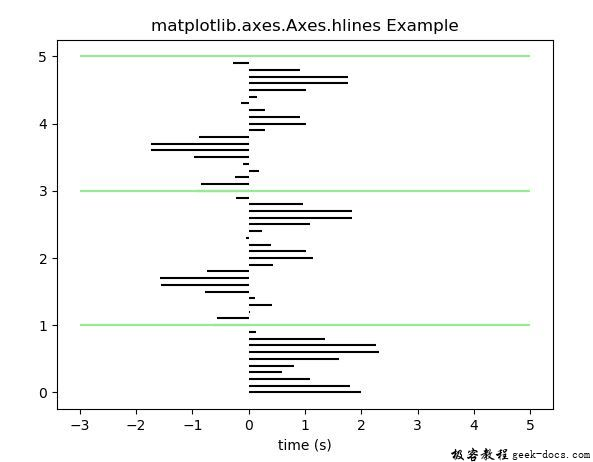
示例2
# Implementation of matplotlib function

import numpy as np
from matplotlib import patches
import matplotlib.pyplot as plt

t = np.arange(0.0, 5.0, 0.1)
s = np.exp(-t) + np.cos(3 * np.pi * t) + np.sin(np.pi * t)
nse = np.random.normal(0.0, 0.8, t.shape) * s

fig, ax = plt.subplots()

ax.hlines(t, [0], s)
ax.set_xlabel('time (s)')
ax.hlines([1, 3, 5], -3, 5, color ="lightgreen")
ax.set_title('matplotlib.axes.Axes.hlines Example')

plt.show()
输出:

 极客教程
极客教程