matplotlib.axes.axes.axvline()
matplotlib.axes.axes.axvline()函数,matplotlib库的Axes模块中的Axes.axvline()函数用于在轴线上添加一条垂直线。
语法:
Axes.axvline(self, x=0, ymin=0, ymax=1, **kwargs)
参数:该方法接受如下参数说明:
- x:表示垂直线在数据坐标中的x位置,默认值为0。
- ymin:这个参数应该在0到1之间,0是图形的底部,1是图形的顶部.默认值为0。
- ymax:这个参数应该在0到1之间,0是图形的底部,1是图形的顶部。默认值为1。
返回如下内容:
- lines:返回表示绘制数据的Line2D对象列表。
下面的例子演示了matplotlib.axes中的matplotlib.axes.axhline()函数:
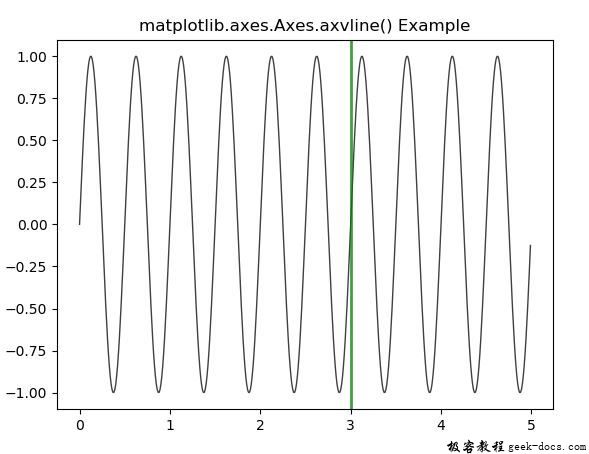
示例1
# Implementation of matplotlib function
import matplotlib.pyplot as plt
import numpy as np
import matplotlib.collections as collections

t = np.arange(0.0, 5, 0.01)
s1 = np.sin(4 * np.pi * t)

fig, ax = plt.subplots()

ax.plot(t, s1, color ='black', alpha = 0.75, lw = 1)
ax.axvline(3, color ='green', lw = 2, alpha = 0.75)
ax.set_title('matplotlib.axes.Axes.axvline() Example')
plt.show()
输出:

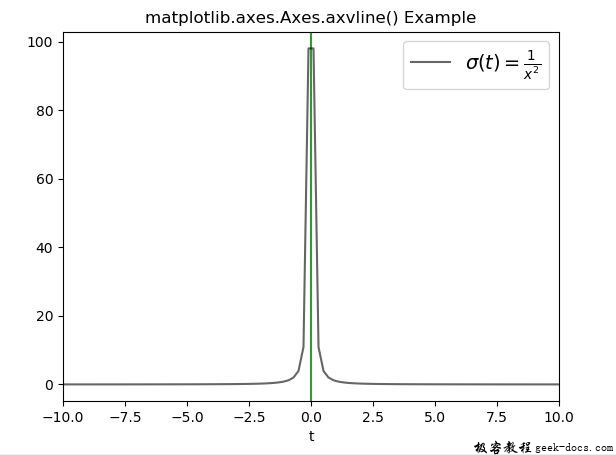
示例2
# Implementation of matplotlib function
import matplotlib.pyplot as plt
import numpy as np

t = np.linspace(-10, 10, 100)
sig = 1 / t**2
fig, ax = plt.subplots()

plt.axvline(color ="green", alpha = 0.8, lw = 1.5)
plt.plot(t, sig, linewidth = 1.5, color ="black",
         alpha = 0.6,
         label = r"\sigma(t) = \frac{1}{x ^ 2}")

plt.xlim(-10, 10)
plt.xlabel("t")
plt.legend(fontsize = 14)

ax.set_title('matplotlib.axes.Axes.axvline() Example')
plt.show()
输出:

 极客教程
极客教程