matplotlib.axes.axes.stem
matplotlib.axes.axes.stem()函数,使用matplotlib库的Axes模块中的Axes.stem()函数创建茎叶图。
语法:
Axes.stem(self, *args, linefmt=None, markerfmt=None, basefmt=None, bottom=0, label=None, use_line_collection=False, data=None)
参数:该方法接受如下参数说明:
- x:该参数为杆的x坐标序列。
- y:该参数为杆头的y坐标序列。
- linefmt:该参数是定义竖线属性的字符串。
- markerfmt:此参数是定义干头部标记的属性的字符串。
- basefmt:这个参数是定义基线属性的字符串。
- bottom:基线的y轴位置。
- label:该参数为图例中茎的标签。
返回如下内容:
- StemContainer:返回的容器可以像元组一样处理(markerline, stemlines, baseline).
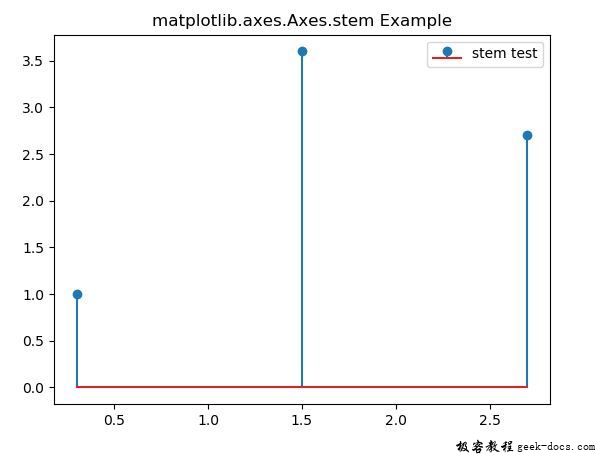
下面的例子演示了matplotlib.axes.axes.broken_barh()函数在matplotlib.axes中的作用:
示例1
# Implementation of matplotlib function
import matplotlib.pyplot as plt

fig, ax = plt.subplots()

ax.stem([0.3, 1.5, 2.7],
        [1, 3.6, 2.7],
        label ="stem test")

ax.legend()
ax.set_title('matplotlib.axes.Axes.stem Example')
plt.show()
输出:

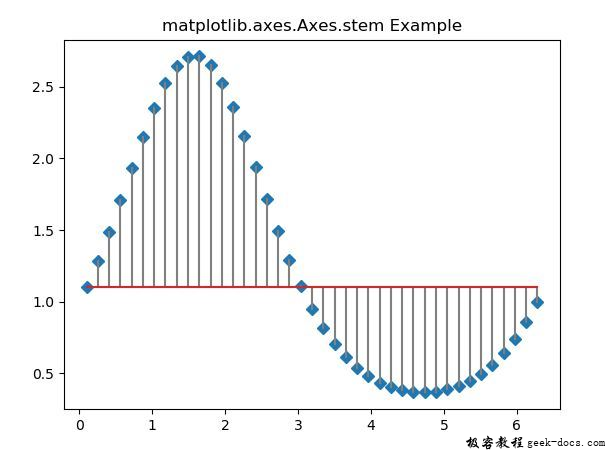
示例2
# Implementation of matplotlib function
import matplotlib.pyplot as plt
import numpy as np

x = np.linspace(0.1, 2 * np.pi, 41)
y = np.exp(np.sin(x))

fig, ax = plt.subplots()

ax.stem(x, y, linefmt ='grey',
        markerfmt ='D',
        bottom = 1.1,
        use_line_collection = True)

ax.set_title('matplotlib.axes.Axes.stem Example')
plt.show()

 极客教程
极客教程