matplotlib.axes.axes.scatter
matplotlib.axes.axes.scatter()函数,matplotlib库的Axes模块中的Axes.scatter()函数用于绘制y与x的散点图,并使用不同的标记大小或颜色。
语法:
Axes.scatter(self, x, y, s=None, c=None, marker=None, cmap=None, norm=None, vmin=None, vmax=None, alpha=None, linewidths=None, verts=, edgecolors=None, *, plotnonfinite=False, data=None, **kwargs)参数:该方法接受如下参数说明:
- x, y:这些参数是数据点的水平和垂直坐标。
- s:可选参数,包含点大小为**2的标记。
- c:可选参数,包含颜色的顺序。
- marker:可选参数。它包含了marker样式。
- cmap:该参数也是一个可选参数,包含注册的colormap名称.默认值为NONE。
- norm:可选参数。它用于缩放亮度数据到0,1 .默认值为NONE。
- vmin、vmax:这些参数与norm一起使用,对默认值None的亮度数据进行归一化。
- alpha:可选参数。它们将值混合在0(透明)和1(不透明)之间。
- linewidths:该参数也是一个可选参数。它是标记边线的线宽.它的默认值是None。
- edgecolors:该参数也是可选参数。它是颜色或{‘ face ‘, ‘ none ‘, ‘None}的序列。
- plotnonfiniteboolean:可选参数。它是标记边线的线宽.它的默认值是None。
返回一个容器,它由以下部分组成:
- plotline:返回x、y plot标记和/或line的Line2D实例。
- caplines:返回错误条帽的Line2D实例的元组。
- barlinecols:返回LineCollection的元组,包含水平和垂直的错误范围。
下面的例子演示了matplotlib.axes.axes.errorbar()函数在matplotlib.axes中的作用:
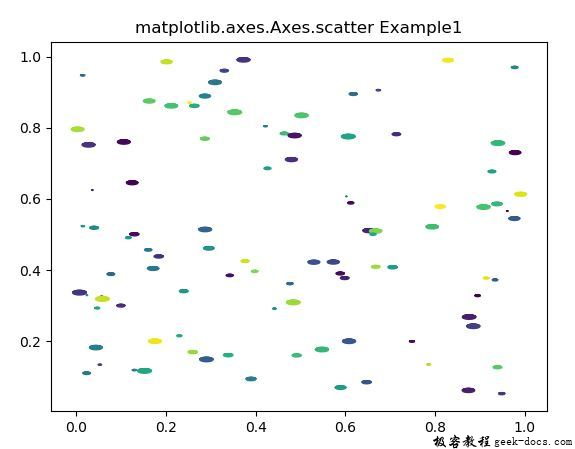
示例1
# Implementation of matplotlib function

import matplotlib.pyplot as plt
import numpy as np

# unit value1 ellipse
rx, ry = 3., 1.
value1 = rx * ry * np.pi
value2 = np.arange(0, 3 * np.pi + 0.01, 0.2)

value3 = np.column_stack([rx / value1 * np.cos(value2),
                          ry / value1 * np.sin(value2)])

x, y, s, c = np.random.rand(4, 99)
s *= 10**2.

fig, ax = plt.subplots()
ax.scatter(x, y, s, c, marker = value3)
ax.set_title("matplotlib.axes.Axes.scatter Example1")
plt.show()
输出:

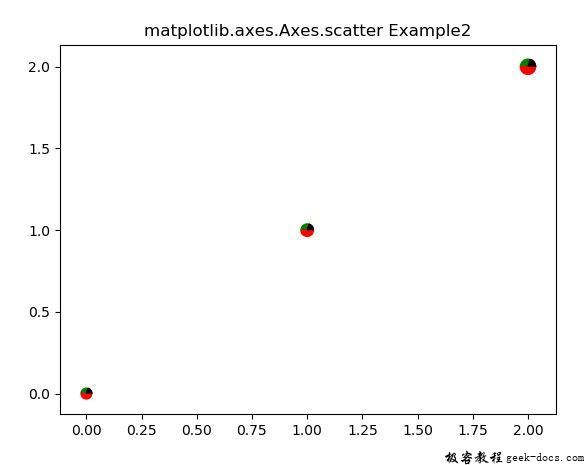
示例2
# Implementation of matplotlib function

import numpy as np
import matplotlib.pyplot as plt

# first define the ratios
r1 = 0.2
r2 = r1 + 0.3
r3 = r2 + 0.7

# define some sizes of the
# scatter marker
sizes = np.array([60, 80, 120, 50])

# calculate the points of the
# first pie marker
x1 = np.cos(2 * np.pi * np.linspace(0, r1))
y1 = np.sin(2 * np.pi * np.linspace(0, r1))

xy1 = np.row_stack([[0, 0],
                    np.column_stack([x1, y1])])

s1 = np.abs(xy1).max()

x2 = np.cos(2 * np.pi * np.linspace(r1, r2))
y2 = np.sin(2 * np.pi * np.linspace(r1, r2))

xy2 = np.row_stack([[0, 0],
                    np.column_stack([x2, y2])])

s2 = np.abs(xy2).max()

x3 = np.cos(2 * np.pi * np.linspace(r2, r3))
y3 = np.sin(2 * np.pi * np.linspace(r2, r3))
xy3 = np.row_stack([[0, 0],
                    np.column_stack([x3, y3])])

s3 = np.abs(xy3).max()

x4 = np.cos(2 * np.pi * np.linspace(r3, 1))
y4 = np.sin(2 * np.pi * np.linspace(r3, 1))
xy4 = np.row_stack([[0, 0],
                    np.column_stack([x4, y4])])

s4 = np.abs(xy4).max()

fig, ax = plt.subplots()
ax.scatter(range(3), range(3),
           marker = xy1, s = s1**2 * sizes,
           facecolor ='blue')

ax.scatter(range(3), range(3),
           marker = xy2, s = s2**2 * sizes,
           facecolor ='green')

ax.scatter(range(3), range(3),
           marker = xy3, s = s3**2 * sizes,
           facecolor ='red')

ax.scatter(range(3), range(3),
           marker = xy4, s = s4**2 * sizes,
           facecolor ='black')

ax.set_title("matplotlib.axes.Axes.scatter Example2")
plt.show()
输出:

 极客教程
极客教程