matplotlib.axes.axes.broken_barh()
matplotlib.axes.axes.broken_barh()函数,matplotlib库的Axes模块中的Axes.broken_barh()函数用于绘制水平矩形序列。
语法:
Axes.broken_barh(self, xranges, yrange, *, data=None, **kwargs)
参数:该方法接受如下参数说明:
- y:该参数是杆的y坐标序列。
- xranges:这个参数是元组(xmin, xwidth)的序列.它是矩形的x位置和扩展。
- yrange:这个参数是元组序列(ymin, yheight).它是y位置,并为所有矩形扩展。
返回如下内容:
- BrokenBarHCollection:返回包含所有broken_barh的容器。
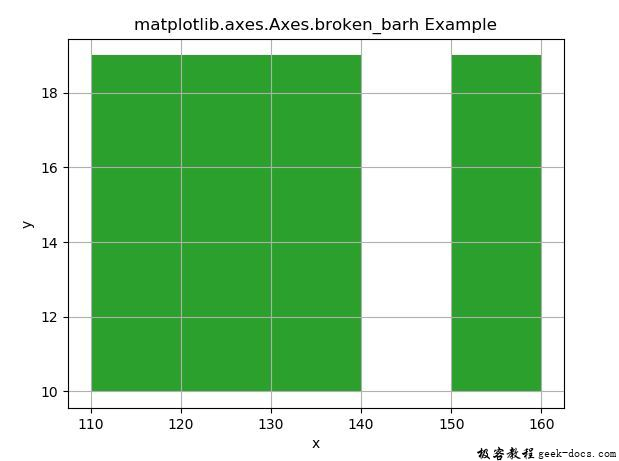
下面的例子演示了matplotlib.axes中的matplotlib.axes.broken_barh()函数:
示例1
# Implementation of matplotlib function
import matplotlib.pyplot as plt

fig, ax = plt.subplots()
ax.broken_barh([(110, 30), (150, 10)],
               (10, 9),
               facecolors ='tab:green')

ax.set_xlabel('x')
ax.set_ylabel('y')
ax.grid(True)

ax.set_title('matplotlib.axes.Axes.\
broken_barh Example')
plt.show()
输出:

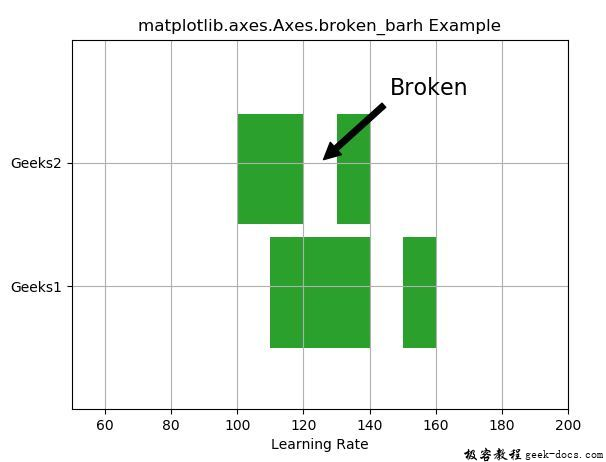
示例2
# Implementation of matplotlib function
import matplotlib.pyplot as plt

fig, ax = plt.subplots()
ax.broken_barh([(110, 30), (150, 10)],
               (10, 9),
               facecolors ='tab:green')

ax.broken_barh([(100, 20),
                (130, 10)],
               (20, 9),
               facecolors =('tab:green'))

ax.set_ylim(5, 35)
ax.set_xlim(50, 200)
ax.set_xlabel('Learning Rate')
ax.set_yticks([15, 25])
ax.set_yticklabels(['Geeks1', 'Geeks2'])
ax.grid(True)

ax.annotate('Broken', (125, 25),
            xytext =(0.8, 0.9),
            textcoords ='axes fraction',
            arrowprops = dict(facecolor ='black',
                              shrink = 0.05),
            fontsize = 16,
            horizontalalignment ='right',
            verticalalignment ='top')

ax.set_title('matplotlib.axes.Axes.broken_barh Example')

plt.show()
输出:

 极客教程
极客教程