matplotlib.axes.axes.step
matplotlib.axes.axes.step()函数,使用matplotlib库的Axes模块中的Axes.errorbar()函数制作步进图。
语法:
Axes.step(self, x, y, *args, where='pre', data=None, **kwargs)
参数:该方法接受如下参数说明:
- x, y:这些参数是数据点的水平和垂直坐标。
- fmt:可选参数,包含字符串值。
- data:也是可选参数。它是带有标签数据的对象。
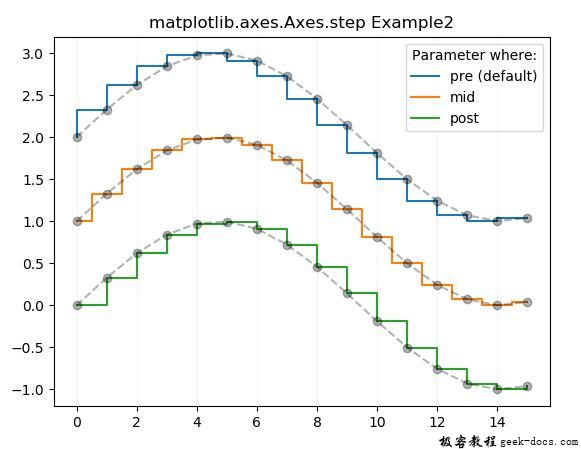
- where:该参数为可选参数。它用来定义步骤应该放在哪里。值为{‘ pre ‘, ‘ post ‘, ‘ mid ‘}。Pre为默认值
返回如下内容:
- lines:返回表示绘制数据的Line2D对象列表。
下面的例子演示了matplotlib.axes.axes.step()函数在matplotlib.axes中的作用:
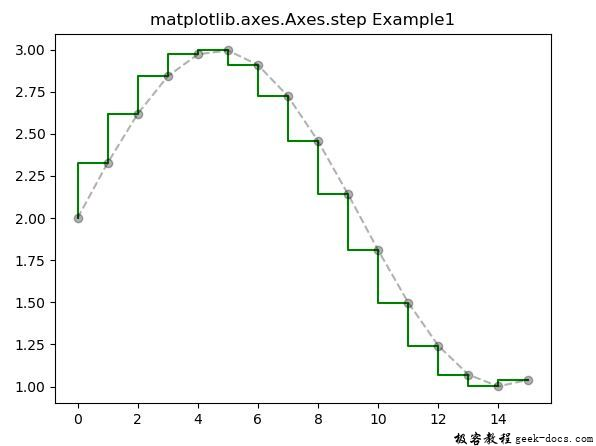
示例1
# Implementation of matplotlib function

import numpy as np
import matplotlib.pyplot as plt

x = np.arange(16)
y = np.sin(x / 3)

fig, ax = plt.subplots()

ax.step(x, y + 2, color ='green')
ax.plot(x, y + 2, 'o--', color ='black', alpha = 0.3)

ax.set_title('matplotlib.axes.Axes.step Example1')
plt.show()
输出:

示例2
# Implementation of matplotlib function

import numpy as np
import matplotlib.pyplot as plt

x = np.arange(16)
y = np.sin(x / 3)

fig, ax = plt.subplots()

ax.step(x, y + 2, label ='pre (default)')
ax.plot(x, y + 2, 'o--', color ='black', alpha = 0.3)

ax.step(x, y + 1, where ='mid', label ='mid')
ax.plot(x, y + 1, 'o--', color ='black', alpha = 0.3)

ax.step(x, y, where ='post', label ='post')
ax.plot(x, y, 'o--', color ='black', alpha = 0.3)

ax.grid(axis ='x', color ='0.95')
ax.legend(title ='Parameter where:')
ax.set_title('matplotlib.axes.Axes.step Example2')
plt.show()
输出:

 极客教程
极客教程