matplotlib.axes.axes.pie
matplotlib.axes.axes.pie()函数,使用matplotlib库的Axes模块中的Axes.pie()函数绘制饼图。
语法:
Axes.pie(self, x, explode=None, labels=None, colors=None, autopct=None, pctdistance=0.6, shadow=False, labeldistance=1.1, startangle=None, radius=None, counterclock=True, wedgeprops=None, textprops=None, center=(0, 0), frame=False, rotatelabels=False, *, data=None)
参数:该方法接受如下参数说明:
- x:此参数为楔子尺寸。
- explode:这个参数是一个len(x)数组,它指定了每个楔子偏移半径的百分比。
- autopct:该参数是一个字符串或函数,用于用它们的数值标记楔子。
- colors:该参数是饼图循环使用的matplotlib颜色参数序列。
- label:这个参数是为每个楔子提供标签的字符串序列。
- pctdistance:该参数是每个饼图切片的中心与autopct生成的文本开始之间的比例。
- shadow:该参数用于在饼图下绘制阴影。
- labeldistance:该参数是绘制饼图标签的径向距离。
- startangle:该参数用于将饼图的起始点从x轴逆时针旋转角度。
- radius:该参数表示饼图的半径。
- counterclock:该参数指定分数方向,顺时针或逆时针。
- wedgeprops:该参数是传递给制作饼的楔形对象的参数的字典。
- textprops:该参数是传递给文本对象的参数的字典。
- center:该参数表示图表的center位置。
- frame:如果为真,该参数用于绘制轴框架。
- rotatelabels:如果为真,该参数用于将每个标签旋转到对应切片的角度。
返回如下内容:
- patch:返回matplotlib.patches.Wedge实例的序列。
- 返回标签matplotlib.text.text实例的列表。
- autotexts:返回数字标签的Text实例列表。
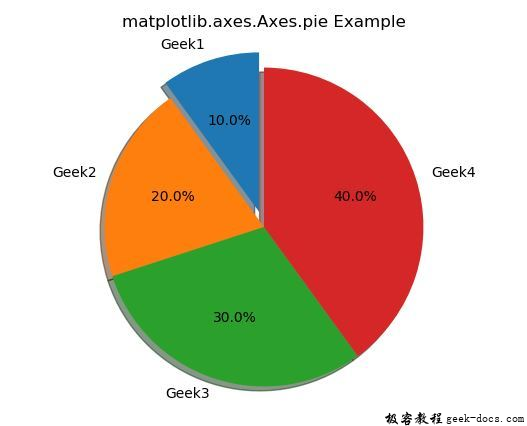
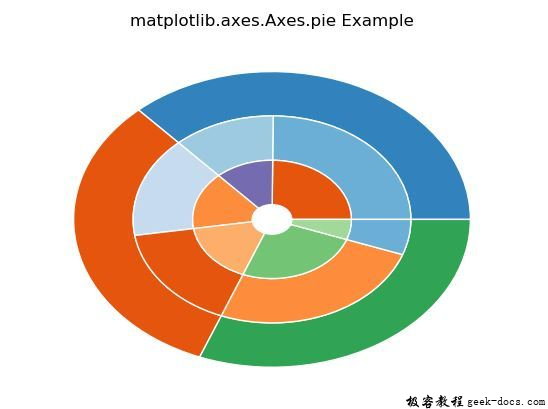
下面的例子演示了matplotlib.axes.axes.pie()函数在matplotlib.axes中的作用:
示例1
# Implementation of matplotlib function
import matplotlib.pyplot as plt

labels = 'Geek1', 'Geek2', 'Geek3', 'Geek4'
sizes = [10, 20, 30, 40]
explode = (0.1, 0, 0, 0)

fig1, ax1 = plt.subplots()
ax1.pie(sizes, explode = explode,
        labels = labels, autopct ='% 1.1f %%',
        shadow = True, startangle = 90)
ax1.axis('equal')

ax1.set_title('matplotlib.axes.Axes.pie Example')
plt.show()
输出:

示例2
# Implementation of matplotlib function
import matplotlib.pyplot as plt
import numpy as np

fig, ax = plt.subplots()

size = 0.3
vals = np.array([[90, 43], [57, 60],
                 [92, 20]])

cmap = plt.get_cmap("tab20c")
outer_colors = cmap(np.arange(3)*4)
mid_colors = cmap(np.array([1, 2, 3, 4, 5, ]))
inner_colors = cmap(np.array([4, 12, 5,
                              6, 9, 10]))

ax.pie(vals.sum(axis = 1), radius = 1,
       colors = outer_colors,
       wedgeprops = dict(width = size,
                         edgecolor ='w'))

ax.pie(vals.flatten(), radius = 1-size,
       colors = mid_colors,
       wedgeprops = dict(width = size,
                         edgecolor ='w'))

ax.pie(vals.flatten(), radius = 1-2 * size,
       colors = inner_colors,
       wedgeprops = dict(width = size,
                         edgecolor ='w'))

ax.set_title('matplotlib.axes.Axes.pie Example')
plt.show()

 极客教程
极客教程