matplotlib.axes.axes.fill()
matplotlib.axes.axes.fill()函数,在matplotlib库的axis模块中使用Axes.fill()函数来绘制填充的多边形。
语法:
Axes.fill(self, *args, data=None, **kwargs)
参数:该方法接受如下参数说明:
- *args:这些参数是其节点的x和y位置列表,后面可选地跟着一个颜色指示符。
- data:可选参数,是带标签数据的对象。
返回多边形列表。
下面的例子演示了matplotlib.axes中的matplotlib.axes.axes()函数:
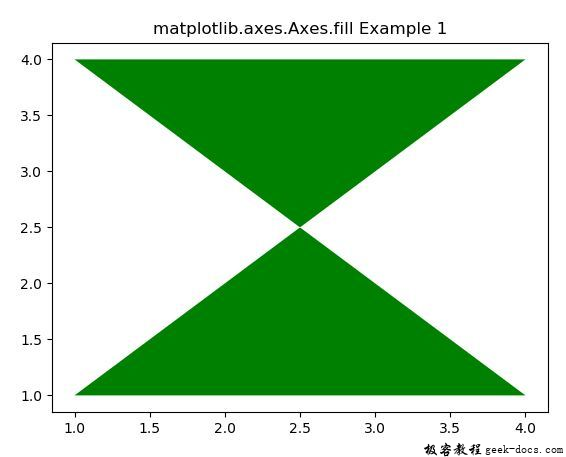
示例1
# Implementation of matplotlib function

import numpy as np
from matplotlib import patches
import matplotlib.pyplot as plt

x = np.array([1, 4, 1, 4])
y = np.array([1, 1, 4, 4])

fig, ax1 = plt.subplots()
ax1.fill(x, y, facecolor ='green')
ax1.set_title('matplotlib.axes.Axes.fill Example 1')
plt.show()
输出:

示例2
# Implementation of matplotlib function

import numpy as np
from matplotlib import patches
import matplotlib.pyplot as plt

theta = np.deg2rad(np.arange(0.0, 360.0, 1.0))
x = 0.5 * np.cos(theta)
y = 0.5 * np.sin(theta)

fig, (ax1, ax2, ax3) = plt.subplots(1, 3, figsize =(9, 3),
                                    subplot_kw ={'aspect': 'equal'},
                                    sharey = True)
ax1.fill(x, y, facecolor ='green')
ax1.set_title('Fig 1')

ax2.fill(x, y, facecolor ='green', edgecolor ='black',
         linewidth = 4)

ax2.set_title('Fig 2')

ax3.fill(x, y, facecolor ='none', edgecolor ='green',
         linewidth = 4)
ax3.set_title('Fig 3')

plt.show()
输出:

 极客教程
极客教程