matplotlib.axes.axes.axhline()
matplotlib.axes.axes.axhline()函数,matplotlib库的Axes模块中的Axes.axhline()函数用于在轴线上添加一条水平线。
语法:
Axes.axhline(self, y=0, xmin=0, xmax=1, **kwargs)
参数:该方法接受如下参数说明:
- y:表示水平线数据坐标的y位置,默认值为0。
- xmin:该参数应该在0到1之间,0是最左边的图形,1是最右边的图形.默认值为0。
- xmax:该参数应该在0到1之间,0是最左边的图形,1是最右边的图形。默认值为1。
返回如下内容:
- lines:返回表示绘制数据的Line2D对象列表。
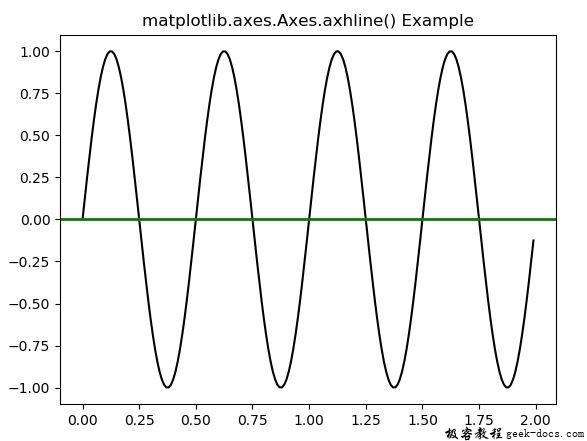
下面的例子演示了matplotlib.axes中的matplotlib.axes.axhline()函数:
示例1
# Implementation of matplotlib function
import matplotlib.pyplot as plt
import numpy as np
import matplotlib.collections as collections

t = np.arange(0.0, 2, 0.01)
s1 = np.sin(4 * np.pi * t)
s2 = 0.75 * np.sin(8 * np.pi * t)

fig, ax = plt.subplots()

ax.plot(t, s1, color ='black')
ax.axhline(0, color ='green', lw = 2)
ax.set_title('matplotlib.axes.Axes.axhline() Example')
plt.show()
输出:

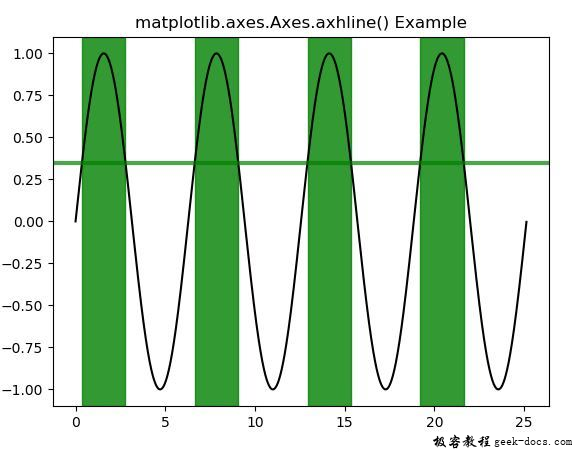
示例2
# Implementation of matplotlib function
import matplotlib.pyplot as plt
import matplotlib.tri as mtri
import numpy as np

fig, ax = plt.subplots()
x = np.arange(0, 8 * np.pi, 0.01)
y = np.sin(x)
ax.plot(x, y, color ='black')

threshold = 0.35
ax.axhline(threshold, color ='green',
           lw = 3, alpha = 0.7)

ax.fill_between(x, 0, 1, where = y > threshold,
                color ='green', alpha = 0.8,
                transform = ax.get_xaxis_transform())

ax.set_title('matplotlib.axes.Axes.axhline() Example')
plt.show()
输出:

 极客教程
极客教程