Matplotlib.axes.axes.contourf()
Matplotlib是Python中的一个库,它是NumPy库的数值-数学扩展。Axes包含了大多数图形元素:Axis、Tick、Line2D、Text、Polygon等,并设置坐标系。Axes的实例通过callbacks属性支持回调。
matplotlib.axes.axes.contourf()函数
matplotlib库的Axes模块中的Axes.contourf()函数也用于绘制轮廓。但是等高线画填充的等高线,而等高线画等高线。
Syntax:
Axes.contourf(self, *args, data=None, **kwargs)
参数:该方法接受如下参数说明:
- X, Y:这些参数是Z中值的坐标。
- Z:这个参数是轮廓被绘制的高度值。
- 级别:用于确定等高线/区域的数量和位置。
返回如下内容:
- c:返回QuadContourSet。
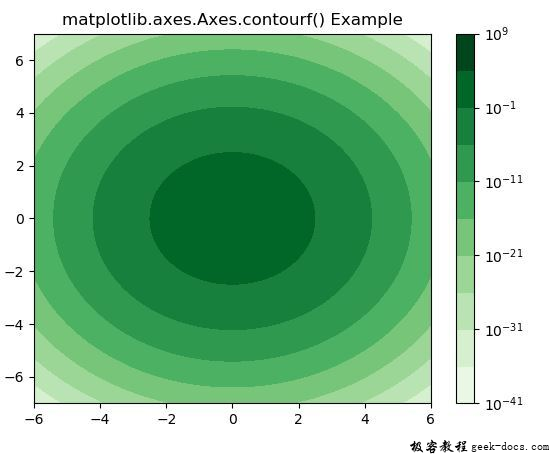
下面的例子演示了matplotlib.axes.axes.contourf()函数在matplotlib.axes.contourf()中的作用:
示例1
# Implementation of matplotlib function
import numpy as np
import matplotlib.pyplot as plt
from numpy import ma
from matplotlib import ticker, cm

N = 1000
x = np.linspace(-6.0, 6.0, N)
y = np.linspace(-7.0, 7.0, N)
X, Y = np.meshgrid(x, y)

Z1 = np.exp(-(X)**2 - (Y)**2)
z = 50 * Z1
z[:5, :5] = -1
z = ma.masked_where(z <= 0, z)

fig, ax = plt.subplots()
cs = ax.contourf(X, Y, z, locator = ticker.LogLocator(),
                 cmap ="Greens")

cbar = fig.colorbar(cs)
ax.set_title('matplotlib.axes.Axes.contourf() Example')

plt.show()
输出:

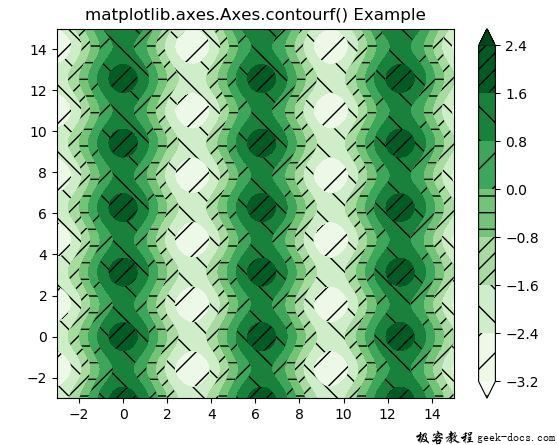
示例2
# Implementation of matplotlib function
import matplotlib.pyplot as plt
import numpy as np

# invent some numbers, turning the
# x and y arrays into simple 2d arrays,
# which make combining them together easier.
x = np.linspace(-3, 15, 450).reshape(1, -1)
y = np.linspace(-3, 15, 720).reshape(-1, 1)
z = np.cos(x)*2 - np.sin(y)**2

# we no longer need x and y to be
# 2 dimensional, so flatten them.
x, y = x.flatten(), y.flatten()

fig1, ax1 = plt.subplots()
cs = ax1.contourf(x, y, z, hatches =['-', '/', '\\', '//'],
                  cmap ='Greens', extend ='both', alpha = 1)
fig1.colorbar(cs)
ax1.set_title('matplotlib.axes.Axes.contourf() Example')
plt.show()
输出:

 极客教程
极客教程