Matplotlib.axes.axes.axis()
Matplotlib是Python中的一个库,它是NumPy库的数值-数学扩展。Axes包含了大多数图形元素:Axis、Tick、Line2D、Text、Polygon等,并设置坐标系。Axes的实例通过callbacks属性支持回调。
函数:matplotlib.axes.axes.axis
matplotlib库的Axes模块中的Axes.axis()函数是获取或设置一些axis属性的方便方法。
Axes.axis(self, *args, **kwargs)
参数:该方法接受如下参数说明:
- xmin, xmax, ymin, ymax:这些参数是要设置的轴限制。
axis([xmin, xmax, ymin, ymax])option:该参数用于打开或关闭坐标轴和标签或选项。
- emit:该参数用于检查观察器是否收到了轴限制更改的通知。
该方法返回如下内容:
- xmin, xmax, ymin, ymax:返回轴限制。
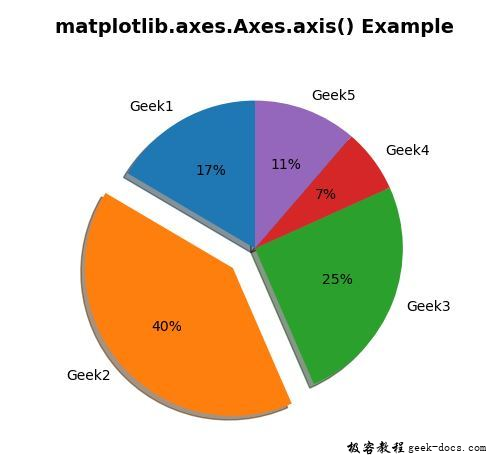
下面的例子说明了matplotlib.axes.axes.axis()函数在matplotlib.axes中的作用:
示例1
# Implementation of matplotlib function
import matplotlib.pyplot as plt
import numpy as np

labels = 'Geek1', 'Geek2', 'Geek3', 'Geek4', 'Geek5'
sizes = [95, 230, 145, 40, 65]
explode = (0, 0.2, 0, 0, 0)

fig1, ax1 = plt.subplots()
ax1.pie(sizes, explode = explode, labels = labels,
        autopct ='% 1.0f %%',
        shadow = True, startangle = 90)
ax1.axis('square')
ax1.set_title('matplotlib.axes.Axes.axis() \
Example\n', fontsize = 14, fontweight ='bold')
plt.show()
输出:

示例2
# Implementation of matplotlib function
import matplotlib.pyplot as plt
import matplotlib.patches as patches
import matplotlib.cbook as cbook

# image used is
# https://media.geeksforgeeks.org / wp-content
# / uploads / 20200402214740 / geek.jpg
with cbook.get_sample_data('geek.JPG') as image_file:
    image = plt.imread(image_file)

fig, (ax, ax1) = plt.subplots(2, 1)
im = ax.imshow(image)
patch = patches.Rectangle((0, 0), 260, 200,
                          transform = ax.transData)
im.set_clip_path(patch)
ax.set_title('Without Axis Function',
             fontsize = 10, fontweight ='bold')

im = ax1.imshow(image)
patch = patches.Rectangle((0, 0), 260, 200,
                          transform = ax1.transData)
im.set_clip_path(patch)
ax1.axis('off')

ax1.set_title("Axis Function with 'Off' option",
              fontsize = 10, fontweight ='bold')
plt.show()
输出:

 极客教程
极客教程