Matplotlib.axes.axes.table()
Matplotlib是Python中的一个库,它是NumPy库的数值-数学扩展。Axes包含了大多数图形元素:Axis、Tick、Line2D、Text、Polygon等,并设置坐标系。Axes的实例通过callbacks属性支持回调。
函数:matplotlib.axes.axes.table
matplotlib库的Axes模块中的Axes.table()函数也用于向Axes添加表。
语法:
Axes.table(ax, cellText=None,cellcolors =None,cellLoc= ‘ right ‘, colWidths=None,rowLabels=None,rowcolors =None,rowLoc= ‘ left ‘, colLabels=None,colcolors =None,colLoc= ‘ center ‘, loc= ‘ bottom ‘, bbox=None,edges= ‘ closed ‘, **kwargs)
参数:该方法接受如下参数说明:
- cellText:该参数包含放置到单元格中的文本。
- cellcolors:该参数是单元格的背景颜色。
- cellLoc:这个参数是文本在单元格内的对齐方式。
- colWidths:该参数是以轴为单位的列宽度。
- rowLabels:该参数是行标题单元格的文本。
- rowcolors:该参数是行标题单元格的颜色。
- rowLoc:该参数是行标题单元格的文本对齐方式。
- colLabels:该参数是列标题单元格的文本。
- colcolors:该参数是列标题单元格的颜色。
- colLoc:该参数是列的文本对齐方式
头细胞。- Loc:这个参数是单元格相对于ax的位置。
- bbox:该参数是绘制表格的边界框。
- edges:该参数是单元格的边线。
返回如下内容:
- table:该方法返回已创建的表。
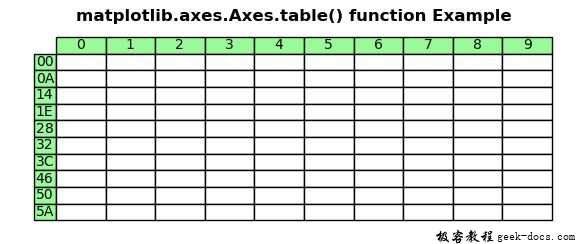
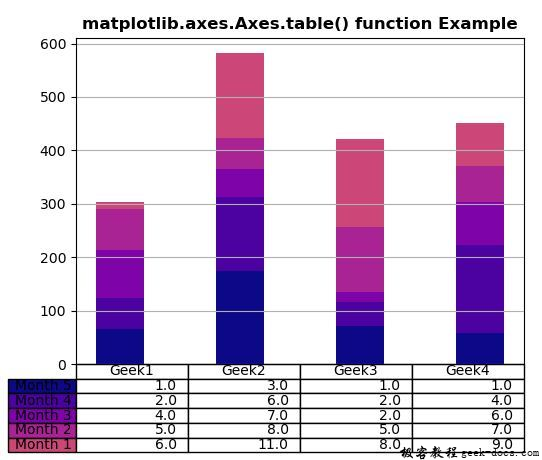
下面的例子演示了matplotlib.axes.axes.table()函数在matplotlib.axes中的作用:
示例1
# Implementation of matplotlib function
import matplotlib.pyplot as plt

val1 = ["{:X}".format(i) for i in range(10)]
val2 = ["{:02X}".format(10 * i) for i in range(10)]
val3 = [["" for c in range(10)] for r in range(10)]

fig, ax = plt.subplots()
ax.set_axis_off()
table = ax.table(
    cellText = val3,
    rowLabels = val2,
    colLabels = val1,
    rowColours =["palegreen"] * 10,
    colColours =["palegreen"] * 10,
    cellLoc ='center',
    loc ='upper left')

ax.set_title('matplotlib.axes.Axes.table() function Example',
             fontweight ="bold")

plt.show()
输出:

示例2
# Implementation of matplotlib function
import numpy as np
import matplotlib.pyplot as plt


data = [[ 66, 174,  71, 58],
        [ 58, 139,  45, 164],
        [ 89,  52, 18, 81],
        [ 78,  58, 123,  68],
        [13, 159, 164, 80]]

val1 = ('Geek1', 'Geek2', 'Geek3', 'Geek4')
val2 = ['Month % d' % x for x in (5, 4, 3, 2, 1)]
val3 = np.arange(0, 2500, 500)
val4 = 1000
val5 = plt.cm.plasma(np.linspace(0, 0.5, len(val2)))
val6 = len(data)
val7 = np.arange(len(val1)) + 0.3
val8 = 0.4
val9 = np.zeros(len(val1))

lista = []

fig, ax = plt.subplots()

for row in range(val6):

    ax.bar(val7, data[row], val8, bottom = val9,
           color = val5[row])
    val9 = val9 + data[row]

    lista.append([(x // 50) for x in val9])

the_table = ax.table(cellText = lista,
                      rowLabels = val2,
                      rowColours = val5,
                      colLabels = val1,
                      loc ='bottom')

plt.subplots_adjust(left = 0.2, bottom = 0.2)

ax.set_xticks([])

ax.set_title('matplotlib.axes.Axes.table() function Example',
              fontweight ="bold")

plt.grid()
plt.show()
输出:

 极客教程
极客教程