matplotlib.pyplot.semilogx()函数
数据可视化是分析数据的一个重要部分,因为绘制图表有助于提供更好的洞察力和对问题的理解。Matplotlib.pyplot是实现这一功能的最常用库之一。它有助于创建有吸引力的数据,而且超级容易使用。
Matplotlib.pyplot.semilogx()函数
该函数用于将数据可视化,X轴被转换为对数格式。当其中一个参数非常大,因此最初以紧凑的方式存储时,这个函数特别有用。它支持plot()和matplotlib.axes.axes.set_xscale()的所有关键字参数。其他参数是basex、subsx和nonposx。
语法:Matplotlib.pyplot.semilogx(x, y,)
参数:重要参数如下:
- x: x轴上的值。
- y: y轴上的值。
- color:(可选)线条或符号的颜色。
- linewidth:(可选)线路宽度。
- label:可选参数,指定图形的标签
- basex:(可选)x对数的底。标量应该大于1。
- subsx:(可选)次要xticks的位置;None默认自动潜艇,这取决于几十年的情节。
- nonposx:(可选)x中的非正数可以被屏蔽为无效,或者剪切为一个非常小的正数。
- marker:(可选)将点显示为提到的符号。
- markersize:(可选)改变所有标记的大小。
返回:x轴上的对数比例图。
示例1
简单图
#import required library
import matplotlib.pyplot as plt

# defining the values
# at X and Y axis
x = [1, 2, 3,
     4, 5, 6]
y = [100, 200, 300,
     400, 500, 600]

# plotting the given graph
plt.semilogx(x, y, marker = ".",
             markersize = 15,
             color = "green")
# plot with grid
plt.grid(True)

# show the plot
plt.show()
输出:
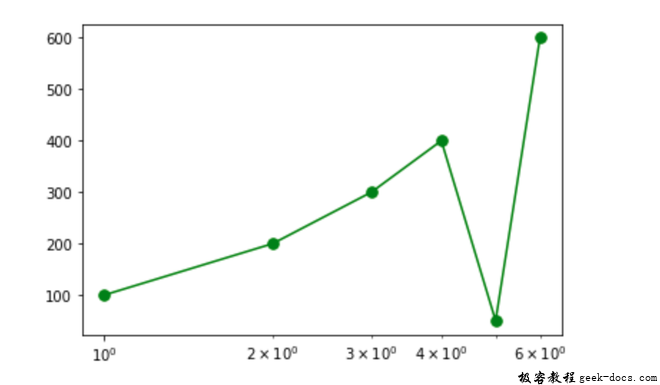
示例2
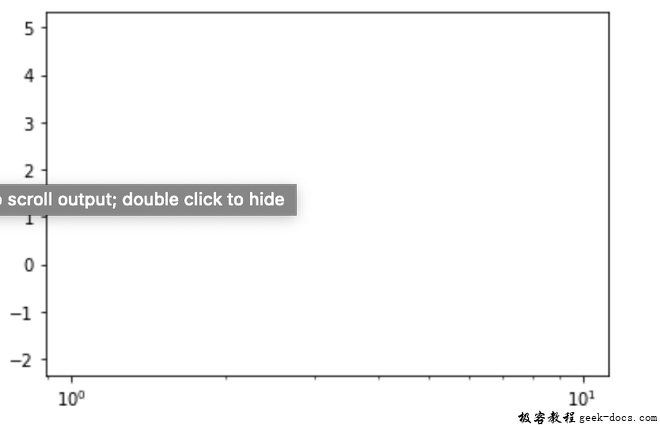
在X和Y轴上使用负值和零值。 由于对数函数涉及到x轴,很明显,负数或正值将被剪切或屏蔽,这由nonposx参数指定。默认情况下,负数或零值会被裁剪。
# importing required libraries
import matplotlib.pyplot as plt


# defining the values
# at X and Y axis
x = [-1, -2, 0]
y = [5, -2, 0]

# plotting the given graph
plt.semilogx(x,y)

# show the plot
plt.show()
输出:
示例3
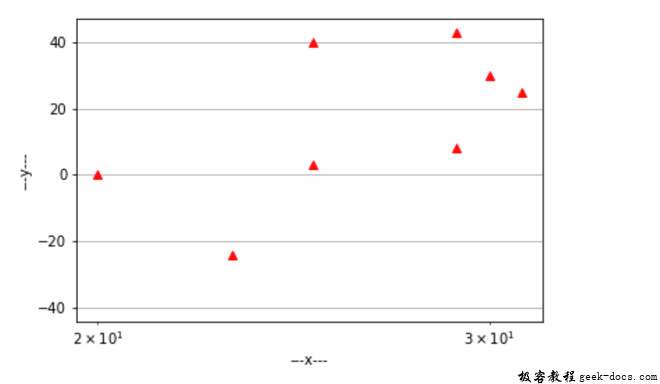
如果使用符号,则只删除负值或零值,只绘制正值。
#import required library
import matplotlib.pyplot as plt

# defining the values at X and Y axis
x = [-10, 30, 0, 20,
     -50, 25, 29, -3
     , 23, 25, 29, 31]
y = [-3, 30, -10, 0,
     -40, 3, 8, 0,
     -24, 40, 43, 25]

# plotting the graph
plt.semilogx(x,y,'g^', color = "red")

# plot with grid
plt.grid(True)

# set y axis label
plt.ylabel('---y---')

# set x axis label
plt.xlabel('---x---')

# show the plot
plt.show()
输出:
示例4
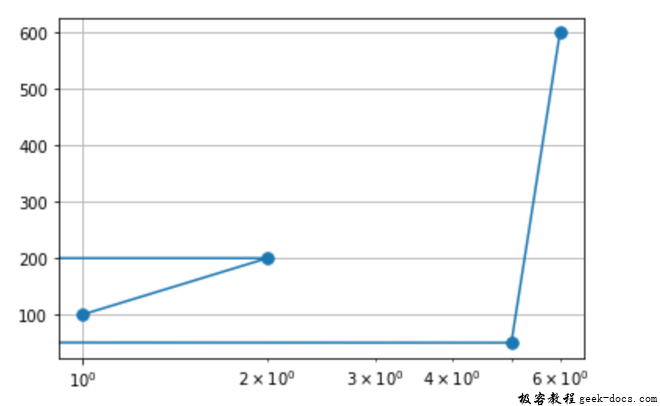
如果使用了这些行,则会剪切这些值。 对应于-3和-4的值被剪切
#import required library
import matplotlib.pyplot as plt

# defining the values
# at X and Y axis
x = [1, 2, -3,
     -4, 5, 6]
y = [100, 200, 300,
     400, 500, 600]

# plotting the graph
plt.semilogx(x, y, marker = ".",
             markersize = 15)

# plot with grid
plt.grid(True)

# show the plot
plt.show()
输出:
示例5
下面的分图将使差异更加清晰。
#import required library
import matplotlib.pyplot as plt

# specifying the subplot
fig, axes = plt.subplots(nrows = 4,
                         ncols = 4,
                         figsize = (10,10))

# Or equivalently,
# "plt.tight_layout()"
fig.tight_layout()

# subplot 1
plt.subplot(2, 2, 1)
x2 = [0.1, 10, -30]
y2 = [40, -10, 45]

# plotting the given graph
plt.semilogx(x2, y2,
             color = "blue",
             linewidth = 4)
# set the title
plt.title("USING LINE")

# set y axis label
plt.ylabel('-----------y-----------')

# set x axis label
plt.xlabel('-----------x-----------')

# plot with grid
plt.grid(True)


# subplot 2
plt.subplot(2, 2, 2)
x2 = [0.1, 10, -30]
y2 = [40, -10, 45]

# plotting the given graph
plt.semilogx(x2, y2,
             'g^',
             markersize = 20,
             color = "black")
# set the title
plt.title("USING SYMBOL")

# set y axis label
plt.ylabel('-----------y-----------')

# set x axis label
plt.xlabel('-----------x-----------')

# plot with grid
plt.grid(True)

# subplot 3
plt.subplot(2, 2, 3)
x2 = [0.1, 10, -30]
y2 = [40, -10 ,45]

# plotting the given graph
plt.semilogx(x2, y2,
             nonposx = "clip",
             color = "red",
             linewidth = 4)
# set the title
plt.title("CLIPPED")

# set y axis label
plt.ylabel('-----------y-----------')

# set x axis label
plt.xlabel('-----------x-----------')

# plot with grid
plt.grid(True)

# subplot 4
plt.subplot(2, 2, 4)
x2 = [0.1, 10, -30]
y2 = [40, -10, 45]

# plotting the given graph
plt.semilogx(x2, y2,
             nonposx = "mask",
             color = "green",
             linewidth = 4)

# set the title
plt.title("MASKED")

# set y axis label
plt.ylabel('-----------y-----------')

# set x axis label
plt.xlabel('-----------x-----------')

# plot with grid
plt.grid(True)

# show the plot
plt.show()
输出:
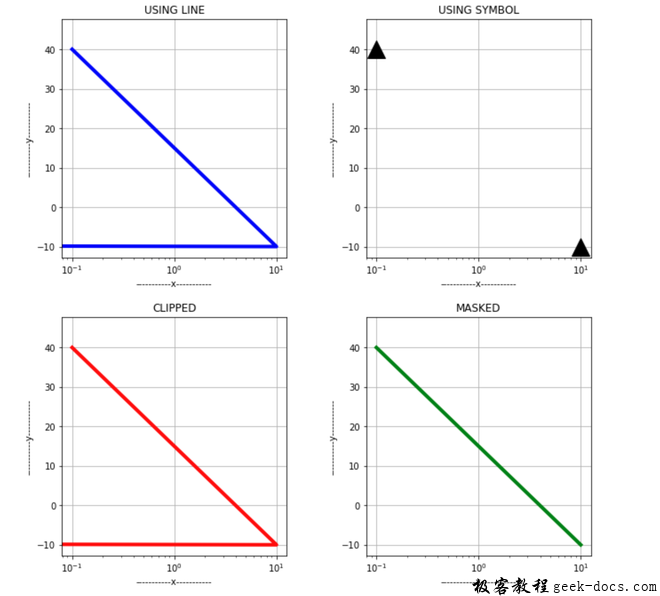
示例6
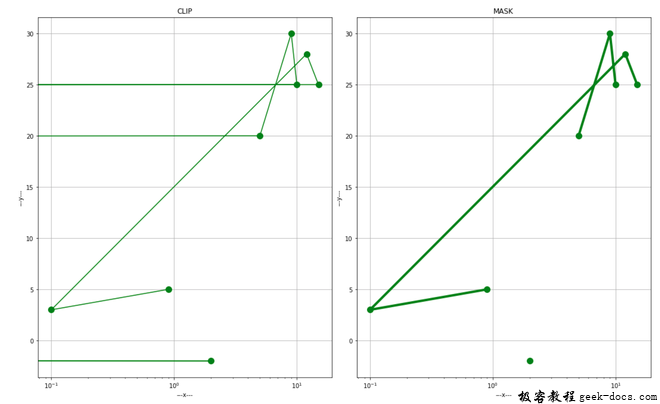
使用nonposx参数。 屏蔽删除无效值,而剪切将它们设置为一个非常低的可能值。
在下面的图中,剪裁和遮蔽之间的区别将更加清楚。
# import required library
import matplotlib.pyplot as plt

fig, axes = plt.subplots(nrows = 1,
                         ncols = 2,
                         figsize = (15,9))
# Or equivalently,  "plt.tight_layout()"
fig.tight_layout()


# subplot 1
x1 = [-1, 2, 0,
      -3, 5, 9,
      10, -3, -8,
      15, 12, 0.1,0.9]

y1 = [5, -2, 0,
      10, 20, 30,
      25, 28, 16,
      25, 28, 3, 5]

plt.subplot(1,2,1)

# plotting the graph
plt.semilogx(x1, y1,
             marker = ".",
             markersize = 20,
             nonposx = "clip",
             color = "green" )

# set the y-axis label
plt.ylabel('---y---')

# set the x-axis label
plt.xlabel('---x---')

# set the title
plt.title('CLIP')

# plot with grid
plt.grid(True)


# subplot 2
x2 = [-1, 2, 0,
      -3, 5, 9,
      10, -3, -8,
      15, 12, 0.1, 0.9]

y2 = [5, -2, 0,
      10, 20, 30,
      25, 28, 16,
      25, 28, 3, 5]

plt.subplot(1,2,2)
plt.semilogx(x2, y2,
             nonposx = "mask",
             color ="green",
             linewidth = 4,
             marker = ".",
             markersize = 20)

# set the title
plt.title('MASK')

# set the y-axis label
plt.ylabel('---y---')

# set the x-axis label
plt.xlabel('---x---')

# plot with grid
plt.grid(True)

# show the plot
plt.show()
输出:
示例7
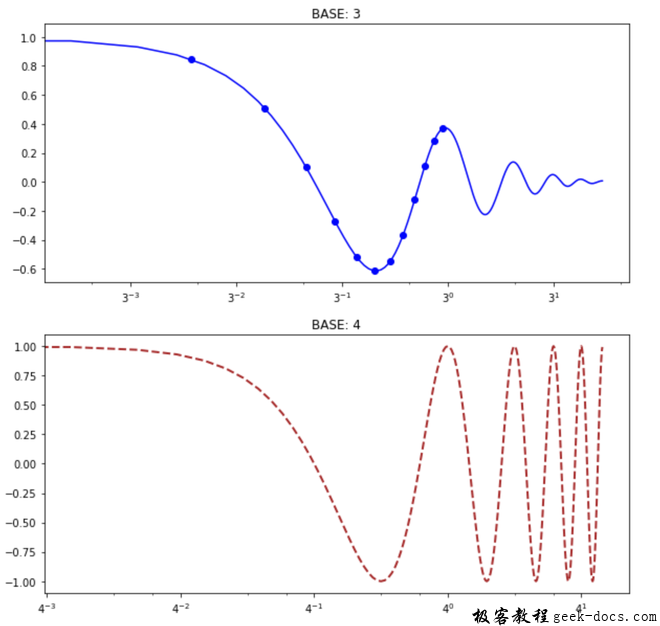
改变底数,根据方便可以设置底数,底数应大于1,以满足对数性质。
# importing the required libraries
import numpy as np
import matplotlib.pyplot as plt

# function that will
# output the values
def function(t):
    return np.exp(-t)*np.sin(2*np.pi.t)/2 + np.tan(t)

# define the x-axis values
t1 = np.arange(-0.01, 1.0, 0.08)
t2 = np.arange(0.0, 5.0, 0.02)


# subplot 1
plt.figure(figsize = (10,10))
plt.subplot(211)

# plot the graph
plt.semilogx(t1, f(t1),
             'bo', t2, f(t2),
             'k', color = "blue",
             basex = 3)
# set the title
plt.title("BASE: 3")

# subplot 2
plt.subplot(212)

# plot the graph
plt.semilogx(t2, np.cos(2*np.pi*t2),
             'r--', color = "brown",
             linewidth = 2, basex = 4)

# set the title
plt.title("BASE: 4")

# show the plot
plt.show()
输出:
示例8
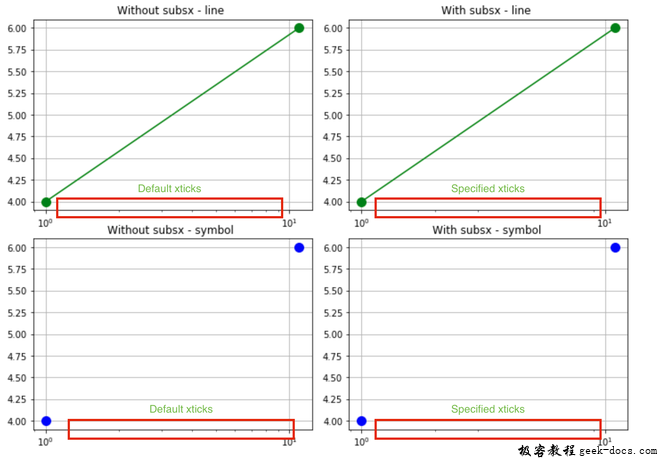
指定X轴上的次要xticks。默认情况下,它取决于图中几十年的数量。
# import required library
import matplotlib.pyplot as plt

fig, axes = plt.subplots(nrows = 2,
                         ncols = 2,
                         figsize = (10,7))

# Or equivalently,  "plt.tight_layout()"
fig.tight_layout()

# subplot 1
plt.subplot(2, 2, 1)
x = [1, 11]
y = [4, 6]

# plot the graph
plt.semilogx(x, y, marker = ".",
             markersize = 20,
             color = "green")

# set the title
plt.title("Without subsx - line ")

# plot with grid
plt.grid(True)


# subplot 2
plt.subplot(2, 2, 2)
x = [1, 11]
y = [4, 6]

# plot the graph
plt.semilogx(x, y, subsx = [2, 3, 9, 10],
             marker = ".", markersize = 20,
             color = "green")

# set the title
plt.title("With subsx - line ")
plt.grid(True)


# subplot 3
plt.subplot(2, 2, 3)
x = [1, 11]
y = [4, 6]
plt.semilogx(x, y, 'g^', marker = ".",
             markersize = 20,
             color = "blue")
plt.title("Without subsx - symbol ")
plt.grid(True)


# subplot 4
plt.subplot(2, 2, 4)
x = [1, 11]
y = [4, 6]
plt.semilogx(x, y, 'g^', subsx=[2, 3, 9, 10],
             marker = ".", markersize = 20,
             color = "blue")
plt.title("With subsx - symbol ")
plt.grid(True)

plt.show()
输出 :
总结
- x轴以对数的方式绘制,基数可以通过定义basex属性来指定。底应该大于1
- 如果绘制了直线,则默认情况下会剪切负值或零值。
- 蒙版属性删除负/零值,而剪辑属性将它们设置为一个非常低的正值。
- 如果使用了符号,则默认情况下会屏蔽负/零。
- semilogx紧跟在plot()和matplotlib.axes.axes.set_xscale()的所有参数之后。
- Subsx参数定义次要xticks。
 极客教程
极客教程