matplotlib.pyplot.margin()函数
Matplotlib.pyplot.margin()是一个用于设置x轴和y轴边距的函数。所有输入参数必须是一个float,它也在[0,1]范围内。不能同时传递位置参数和关键字参数,因为这会引发TypeError。添加到轴的每个极限的填充是边距乘以该轴的数据间隔。如果没有提出任何理由,则现有的差额仍然存在。指定页边距会改变自动缩放。
- 如果只提供一个float值,则该值将作为x和y轴的边距。
- 如果提供了两个float,它们将分别用来指定x-margin和y-margin轴。
语法:
margins(x, y, tight)参数
- x, y:用于指定x和y轴的边缘值。这些只能单独使用。
- tight: Boolean
- 如果此参数指定为True,则认为指定的边距不需要额外填充来匹配标记。
- 如果该参数被设置为None,它将保持原来的设置。
使用此函数的各种实现如下所示:
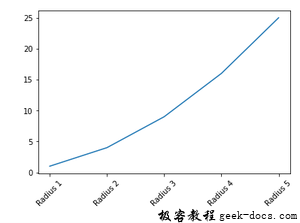
示例1
import matplotlib.pyplot as plt

x = [1, 2, 3, 4, 5]
labels = ['Radius 1', 'Radius 2', 'Radius 3', 'Radius 4', 'Radius 5']
y = [i**2 for i in x]

plt.plot(x, y)
plt.xticks(x, labels, rotation=45)
plt.margins()
plt.show()
输出:

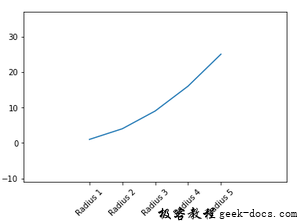
示例2
向margin()函数传递参数
import matplotlib.pyplot as plt

x = [1, 2, 3, 4, 5]
labels = ['Radius 1', 'Radius 2', 'Radius 3', 'Radius 4', 'Radius 5']
y = [i**2 for i in x]

plt.plot(x, y)
plt.xticks(x, labels, rotation=45)
plt.margins(0.5)
plt.show()
输出:

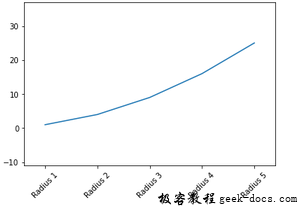
示例3
传递小于1的x和y的不同值,生成的图形将被放大
import matplotlib.pyplot as plt

x = [1, 2, 3, 4, 5]
labels = ['Radius 1', 'Radius 2', 'Radius 3', 'Radius 4', 'Radius 5']
y = [i**2 for i in x]

plt.plot(x, y)
plt.xticks(x, labels, rotation=45)
plt.margins(x=0.1, y=0.5)
plt.show()
输出:

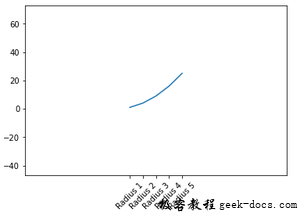
示例4
传递大于的x和y的不同值,生成的图形将被缩小
import matplotlib.pyplot as plt

x = [1, 2, 3, 4, 5]
labels = ['Radius 1', 'Radius 2', 'Radius 3', 'Radius 4', 'Radius 5']
y = [i**2 for i in x]

plt.plot(x, y)
plt.xticks(x, labels, rotation=45)
plt.margins(x=2, y=2)
plt.show()
输出:

 极客教程
极客教程