matplotlib.pyplot.magnitude_spectrum()函数
Matplotlib是Python中的一个库,它是NumPy库的数值-数学扩展。Pyplot是一个基于状态的Matplotlib模块接口,该模块提供了一个类似matlab的接口。Pyplot中可以使用的绘图有直线图、轮廓图、直方图、散点图、三维图等。
matplotlib.pyplot.magnitude_spectrum() Function:
使用matplotlib库pyplot模块中的magnitude_spectrum()函数绘制幅值谱。一般是计算序列的幅值谱,然后作图。
语法:magnitude_spectrum(x, Fs=2, Fc=0, window=mlab.window_hanning, pad_to=None,sides= ‘ default ‘, **kwargs)
参数:该方法接受如下参数说明:
- x:数据序列。
- Fs:标量。默认值为2。
- window:该参数接受一个数据段作为参数,并返回该段的窗口版本。其默认值是window_hanning()
- sides:该参数指定返回频谱的哪一边。它可以有以下值:’ default ‘, ‘ onesided ‘和’ twosided ‘。
- pad_to:该参数包含填充数据段的整数值。
- Fc:该参数还包含整数值,用于偏移图形的x个区段,以反映频率范围。默认值为0
返回如下内容:
- spectrum:以弧度为单位返回角度谱。
- freqs:返回与频谱中元素对应的频率。
- line:返回由该函数创建的行。
结果是(spectrum, freqs, line)
下面的例子演示了matplotlib.pyplot.magnitude_spectrum()函数在matplotlib.pyplot中的作用:
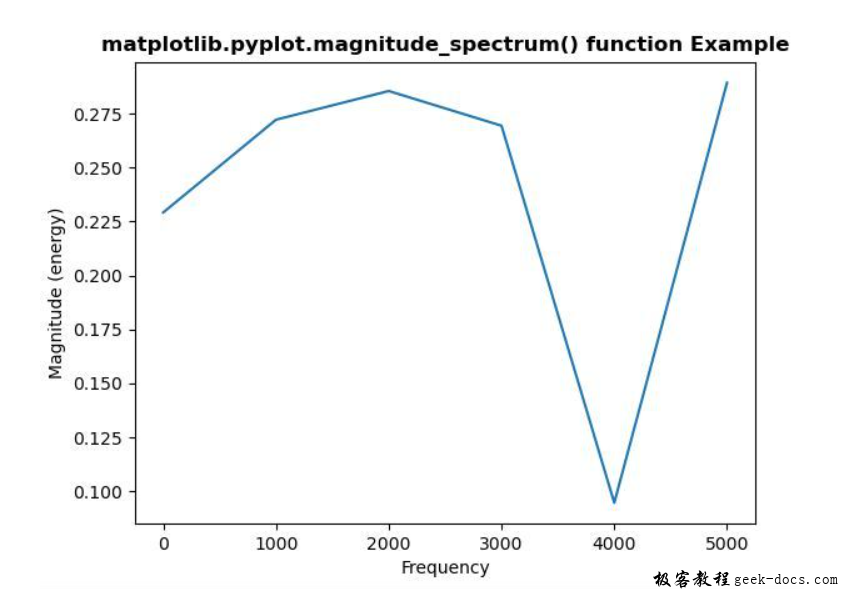
示例1
# Implementation of matplotlib function
import matplotlib.pyplot as plt
import numpy as np

np.random.seed(10**5)

dt = 0.0001
Fs = 1 / dt
geeks = np.array([24.40, 110.25, 20.05, 22.00, 61.90,
                   7.80, 15.00, 22.80, 34.90, 57.30])

nse = np.random.randn(len(geeks))
r = np.exp(-geeks / 0.05)

s = 0.1 * np.sin(2 * np.pi * geeks) + nse

# plot magnitude_spectrum
plt.magnitude_spectrum(s, Fs = Fs)
plt.title('matplotlib.pyplot.magnitude_spectrum() function Example',
                                                 fontweight ="bold")
plt.show()
输出:

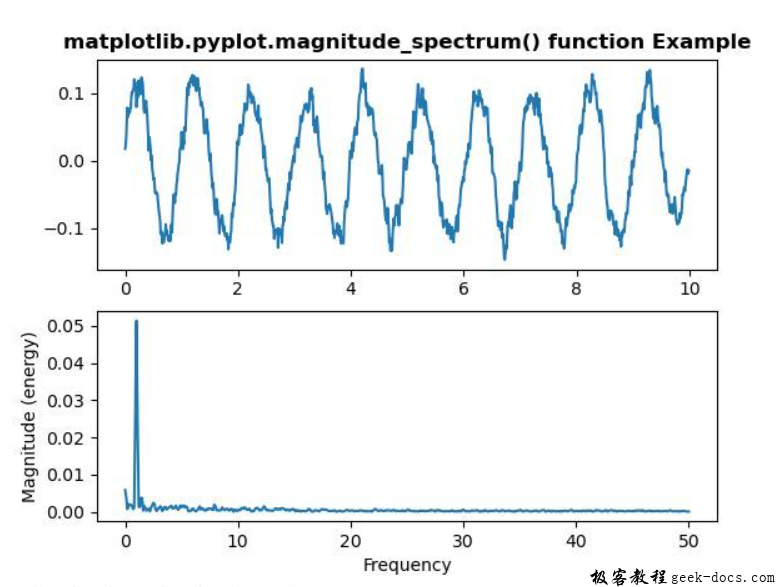
示例2
# Implementation of matplotlib function
import matplotlib.pyplot as plt
import numpy as np

np.random.seed(0)

dt = 0.01
Fs = 1 / dt
t = np.arange(0, 10, dt)
nse = np.random.randn(len(t))
r = np.exp(-t / 0.05)

cnse = np.convolve(nse, r)*dt
cnse = cnse[:len(t)]
s = 0.1 * np.sin(2 * np.pi * t) + cnse

# plot simple spectrum
plt.subplot(2, 1, 1)
plt.plot(t, s)
plt.title('matplotlib.pyplot.magnitude_spectrum() function Example',
                                                 fontweight ="bold")

plt.subplot(2, 1, 2)
plt.magnitude_spectrum(s, Fs = Fs)

plt.show()
输出:

 极客教程
极客教程