matplotlib.pyplot.savefig()函数
Matplotlib是Python中非常有用的可视化库。它是一个多平台的数据可视化库,构建在NumPy数组上,用于更广泛的SciPy堆栈。可视化扮演着非常重要的角色,因为它帮助我们理解大量的数据并提取知识。
Matplotlib.pyplot.savefig()
顾名思义,savefig()方法用于保存绘制数据后创建的图形。使用这种方法,创建的图形可以保存到我们的本地机器上。
语法:
savefig(fname, dpi=None, facecolor=’w’, edgecolor=’w’, orientation=’portrait’, papertype=None, format=None, transparent=False, bbox_inches=None, pad_inches=0.1, frameon=None, metadata=None)
参数:
| PARAMETERS | DESCRIPTION |
|---|---|
| fname | 图片文件名为.png, pdf格式为.pdf。 文件位置也可以在这里指定。 |
| dpi | 每英寸的点数。(画面质量) |
| papertype | 纸张类型可以是“a0到a10”,“executive”, ” b0至b10 “, ” letter “, ” legal “, ” ledger “。 |
| format | 文件格式为.png, .pdf。 |
| facecolor和edgecolor | 默认为白色。 |
| bbox_inches | 将它设置为“紧”,以适合保存的图形。 |
| pad_inches | 在保存的图形周围填充。 |
| transparent | 使图片的背景透明。 |
| Orientation | 风景或肖像。 |
示例1
# importing required modules
import matplotlib.pyplot as plt

# creating plotting data
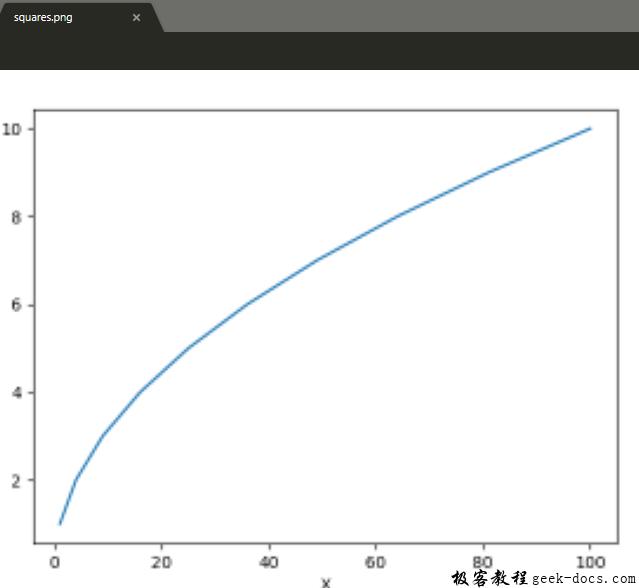
xaxis =[1, 4, 9, 16, 25, 36, 49, 64, 81, 100]
yaxis =[1, 2, 3, 4, 5, 6, 7, 8, 9, 10]

# plotting
plt.plot(xaxis, yaxis)
plt.xlabel("X")
plt.ylabel("Y")

# saving the file.Make sure you
# use savefig() before show().
plt.savefig("squares.png")

plt.show()
输出:

示例2
# importing the modules
import matplotlib.pyplot as plt


# creating data and plotting a histogram
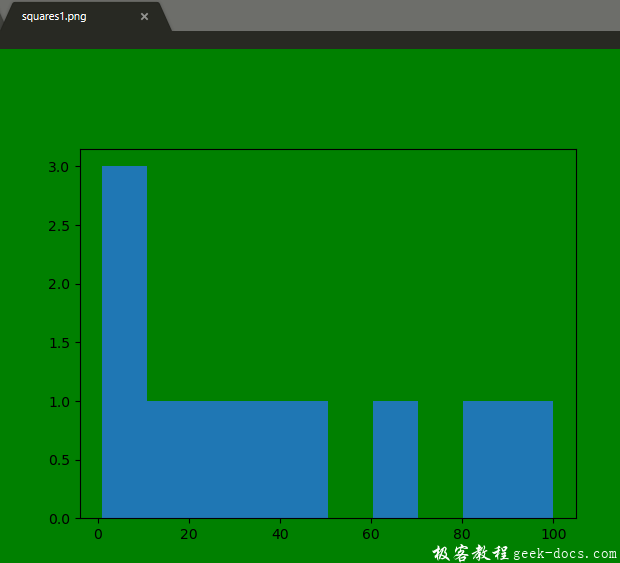
x =[1, 4, 9, 16, 25, 36, 49, 64, 81, 100]
plt.hist(x)

# saving the figure.
plt.savefig("squares1.png",
            bbox_inches ="tight",
            pad_inches = 1,
            transparent = True,
            facecolor ="g",
            edgecolor ='w',
            orientation ='landscape')

plt.show()
输出:

 极客教程
极客教程