matplotlib.pyplot.subplots()函数
Matplotlib是Python中的一个库,它是NumPy库的数值-数学扩展。Pyplot是一个基于状态的Matplotlib模块接口,该模块提供了一个类似matlab的接口。
示例代码
# sample code
import matplotlib.pyplot as plt

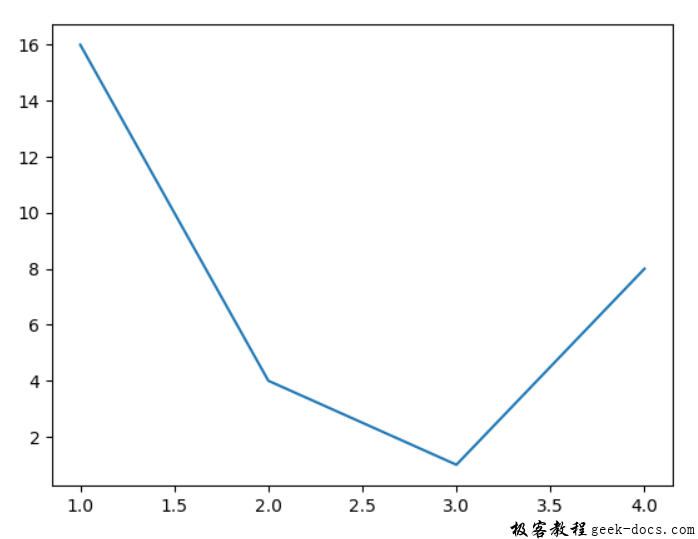
plt.plot([1, 2, 3, 4], [16, 4, 1, 8])
plt.show()
输出:

matplotlib.pyplot.subplots()函数
使用matplotlib库的pyplot模块中的subplot()函数创建一个图形和一组子图。
语法:
matplotlib.pyplot.subplots(nrows=1, ncols=1, sharex=False, sharey=False, squeeze=True, subplot_kw=None, gridspec_kw=None, **fig_kw)参数:该方法接受如下参数说明:
- nrows、ncols:这些参数是子plot网格的行/列数。
- sharex, sharey:这些参数控制x (sharex)或y (sharey)轴之间的属性共享。
- squeeze:该参数为可选参数,包含布尔值,默认为True。
- num:此参数是pyplot.figure关键字,用于设置数字或标签。
- subplot_kwd:该参数是传递给add_subplot调用的关键字的字典,add_subplot用于创建每个子plot。
- gridspec_kw:该参数是传递给GridSpec构造器的关键字的字典,GridSpec构造器用于创建放置子图的网格。
返回:该方法返回以下值。
- 这个方法返回图形布局。
- 这个方法返回ax# @Axes对象或axes对象数组。
下面的例子演示了matplotlib.pyplot.subplot()函数在matplotlib.pyplot中的作用:
示例1
# Implementation of matplotlib function
import numpy as np
import matplotlib.pyplot as plt

# First create some toy data:
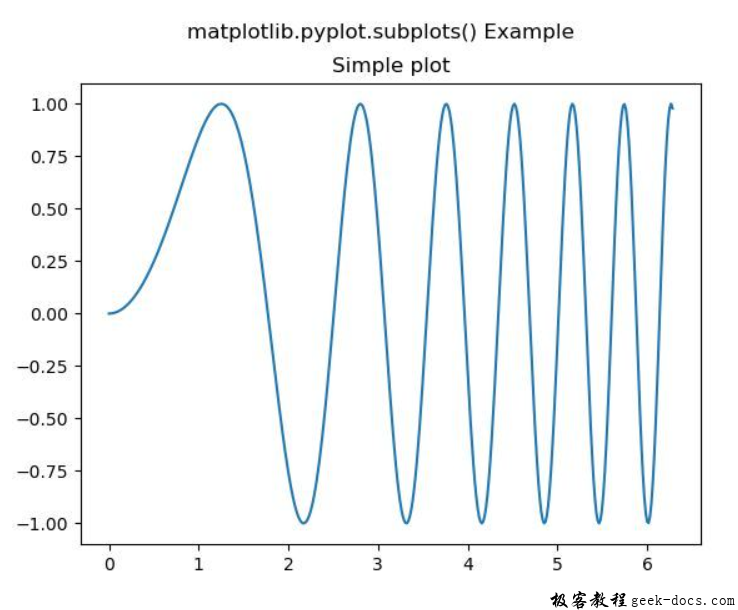
x = np.linspace(0, 2 * np.pi, 400)
y = np.sin(x**2)

fig, ax = plt.subplots()
ax.plot(x, y)
ax.set_title('Simple plot')


fig.suptitle('matplotlib.pyplot.subplots() Example')
plt.show()
输出:

示例2
# Implementation of matplotlib function
import numpy as np
import matplotlib.pyplot as plt

# First create some toy data:
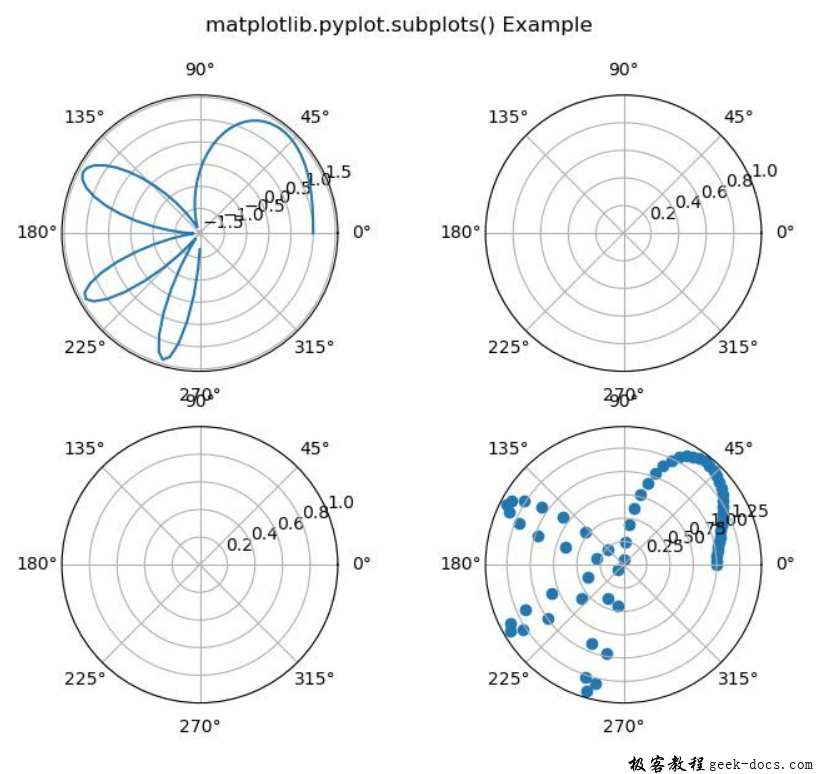
x = np.linspace(0, 1.5 * np.pi, 100)
y = np.sin(x**2)+np.cos(x**2)

fig, axs = plt.subplots(2, 2,
                        subplot_kw = dict(polar = True))
axs[0, 0].plot(x, y)
axs[1, 1].scatter(x, y)

fig.suptitle('matplotlib.pyplot.subplots() Example')
plt.show()
输出:

 极客教程
极客教程