matplotlib.pyplot.text()函数
此函数用于向数据坐标中位于x、y位置的坐标轴添加文本。
Syntax: matplotlib.pyplot.text(x, y, s, fontdict=None, **kwargs)
| 参数 | 描述 |
|---|---|
| x, y:float | 放置文本的位置。默认情况下,这是在数据坐标中。坐标系统可以使用转换参数进行改变。 |
| s: str | 文本。 |
| Fontdict:默认无 | 覆盖默认文本属性的字典。如果fontdict为None,则rcParams确定默认值。 |
| **kwargs | 文本属性。 |
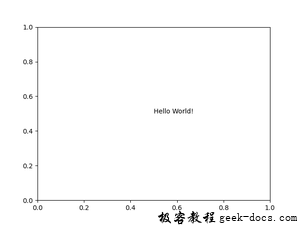
示例1
plot表上的文本
import matplotlib.pyplot

matplotlib.pyplot.text(0.5, 0.5, "Hello World!")
matplotlib.pyplot.savefig("out.png")
输出:

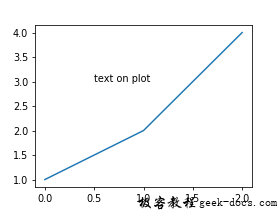
示例2
在plot中添加文本
import matplotlib.pyplot as plt


w = 4
h = 3
d = 70

plt.figure(figsize=(w, h), dpi=d)

x = [1, 2, 4]
x_pos = 0.5
y_pos = 3

plt.text(x_pos, y_pos, "text on plot")
plt.plot(x)
plt.savefig("out.png")
输出:

 极客教程
极客教程