matplotlib.pyplot.tick_params()函数
Matplotlib是Python中一个用于2D数组绘图的可视化库。Matplotlib是一个基于NumPy数组构建的多平台数据可视化库,用于更广泛的SciPy堆栈。
matplotlib.pyplot.tick_params ()
matplotlib.pyplot.tick_params()用于更改刻度、刻度标签和网格线的外观。
语法:
matplotlib.pyplot.tick_params(axis='both', **kwargs)
参数:
| Parameter | Value | Use |
|---|---|---|
| axis | {‘ x ‘, ‘ y ‘, ‘ both ‘},可选 | 将参数应用于哪个轴。默认设置是“两个”。 |
| reset | bool,默认:False | 如果为True,在处理其他关键字参数之前,将所有参数设置为默认值。 |
| which | {‘major’, ‘minor’, ‘both’} | 默认是“主要”;应用勾号的参数。 |
| direction | {‘in’, ‘out’, ‘inout’} | 将刻度置于坐标轴内、轴外,或同时置于两者。 |
| length | float | 以点为单位的滴答长度。 |
| width | float | 默认是“主要”;应用勾号的参数。 |
| color | 颜色 | 蜱虫的颜色。 |
| pad | float | 标记和标签之间的点距离。 |
| labelsize | float或str | 标记的字体大小以点表示或以字符串形式表示(e.g;,“大”)。 |
示例1
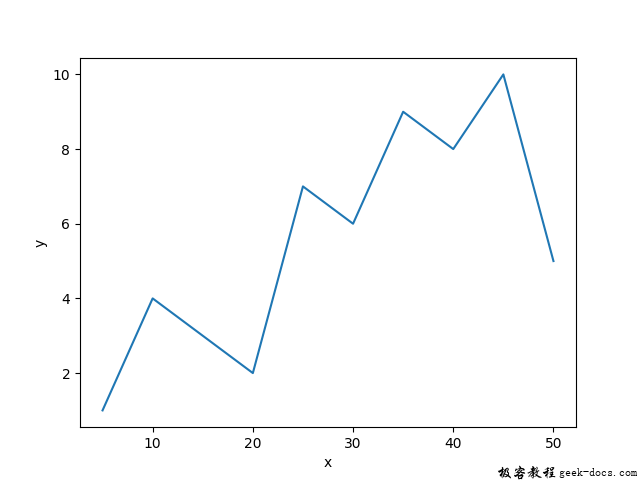
默认plot
# importing libraries
import matplotlib.pyplot as plt

# values of x and y axes
x = [i for i in range(5, 55, 5)]
y = [1, 4, 3, 2, 7, 6, 9, 8, 10, 5]

plt.plot(x, y)
plt.xlabel('x')
plt.ylabel('y')

plt.show()
输出:

示例2
# importing libraries
import matplotlib.pyplot as plt
from matplotlib.ticker import MultipleLocator, ScalarFormatter

fig, ax = plt.subplots()
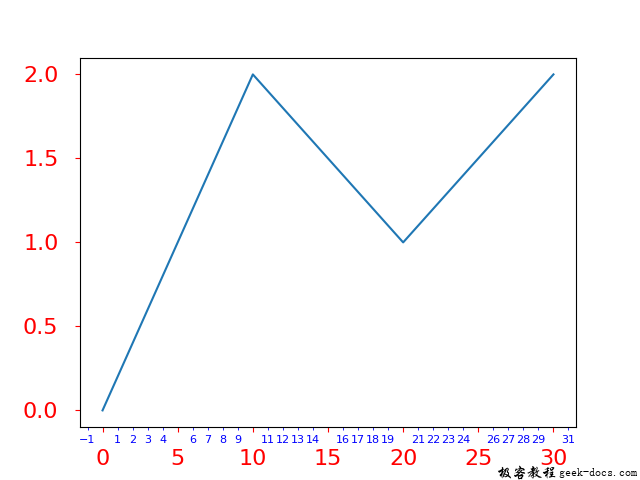
ax.plot([0, 10, 20, 30], [0, 2, 1, 2])

ax.xaxis.set_minor_locator(MultipleLocator(1))
ax.xaxis.set_minor_formatter(ScalarFormatter())

ax.tick_params(axis ='both', which ='major',
               labelsize = 16, pad = 12,
               colors ='r')

ax.tick_params(axis ='both', which ='minor',
               labelsize = 8, colors ='b')

plt.show()
输出:

 极客教程
极客教程