matplotlib.pyplot.delaxes()函数
Matplotlib是Python中的一个库,它是NumPy库的数值-数学扩展。Pyplot是一个基于状态的Matplotlib模块接口,该模块提供了一个类似matlab的接口。
matplotlib.pyplot.delaxes()函数
使用matplotlib库pyplot模块中的delaxes()函数从图形中删除axis。
语法:matplotlib.pyplot.delaxes (ax =没有)
参数:该方法接受如下参数说明:
- ax:该参数是要移除的坐标轴。默认值为None。
下面的例子演示了matplotlib.pyplot.delaxes()函数在matplotlib.pyplot中的作用:
示例1
# Implementation of matplotlib function
import matplotlib.pyplot as plt
import numpy as np

# make an agg figure
fig, ax = plt.subplots()
ax.plot([1, 2, 3])

plt.delaxes()

plt.suptitle('matplotlib.pyplot.delaxes() function Example',
              fontweight ="bold")

plt.show()
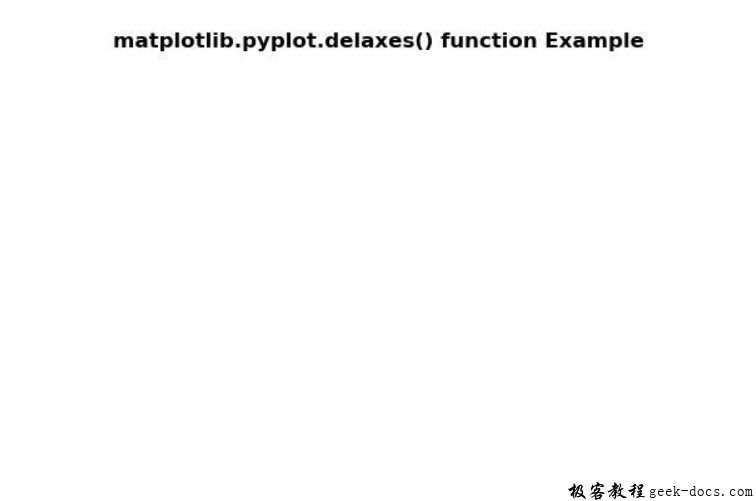
输出:

示例2
# Implementation of matplotlib function
import numpy as np
import matplotlib.pyplot as plt

dt = 0.01
t = np.arange(0, 30, dt)
nse1 = np.random.randn(len(t))
r = np.exp(-t / 0.05)

cnse1 = np.convolve(nse1, r, mode ='same')*dt

s1 = np.cos(np.pi * t) + cnse1 + np.sin(2 * np.pi * 10 * t)

fig, [ax1, ax2] = plt.subplots(2, 1)
ax1.plot(t, s1)
ax1.set_xlim(0, 5)
ax1.set_ylabel('value s1')
ax1.grid(True)

ax2.psd(s1, 256, 1./dt)
ax2.set_ylabel('PSD(db)')
ax2.set_xlabel('Frequency')

plt.delaxes(ax = ax1)

plt.suptitle('matplotlib.pyplot.delaxes() function Example',
              fontweight ="bold")

plt.show()
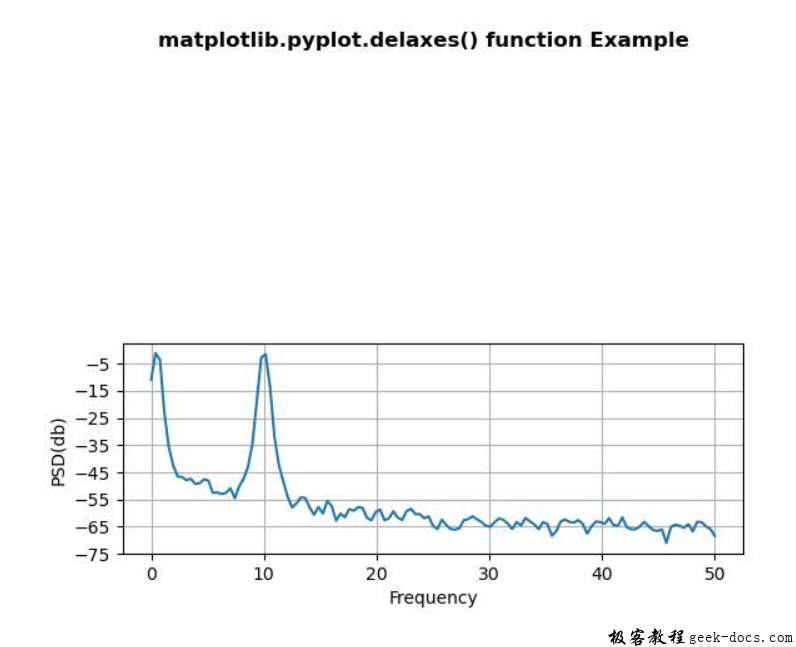
输出:

 极客教程
极客教程