matplotlib.pyplot.contour()函数
Matplotlib是Python中的一个库,它是NumPy库的数值-数学扩展。Pyplot是一个基于状态的Matplotlib模块接口,该模块提供了一个类似matlab的接口。
matplotlib.pyplot.contour()函数
使用matplotlib库pyplot模块中的contour()函数绘制轮廓。
语法:matplotlib.pyplot.contour(\args, data=None, \\*kwargs)
参数:该方法接受如下参数说明:
- X, Y:这些参数是Z中值的坐标。
- Z:这个参数是轮廓被绘制的高度值。
- 级别:用于确定等高线/区域的数量和位置。
返回如下内容:
- c:返回QuadContourSet。
下面的例子演示了matplotlib.pyplot.contour()函数在matplotlib.pyplot中的作用:
示例1
# Implementation of matplotlib function
import numpy as np
import matplotlib.pyplot as plt
import matplotlib.ticker as ticker
import matplotlib

delta = 0.15
x = np.arange(1.5, 2.5, delta)
y = np.arange(1.0, 3.0, delta)
X, Y = np.meshgrid(x, y)
Z = (np.exp(X - Y))


CS1 = plt.contour(X, Y, Z)

fmt = {}
strs = ['1', '2', '3', '4', '5', '6', '7']
for l, s in zip(CS1.levels, strs):
    fmt[l] = s
plt.clabel(CS1, CS1.levels, inline = True,
           fmt = fmt, fontsize = 10)

plt.title('matplotlib.pyplot.contour() Example')
plt.show()
输出:

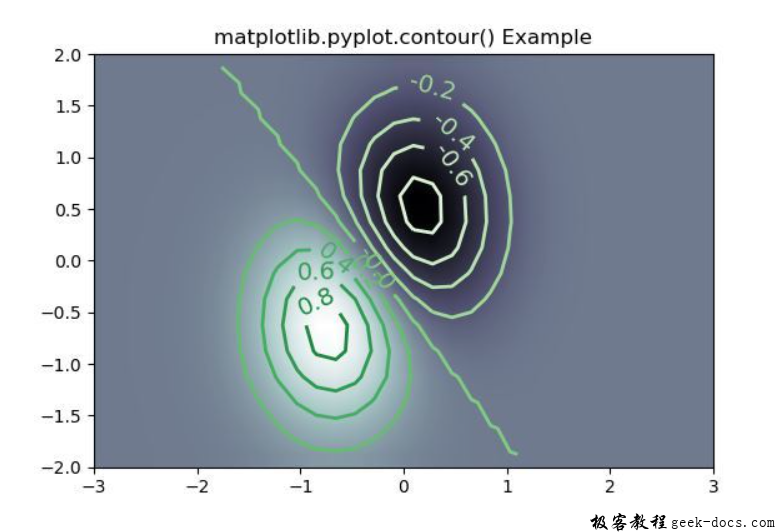
示例2
# Implementation of matplotlib function
import matplotlib
import numpy as np
import matplotlib.cm as cm
import matplotlib.pyplot as plt

delta = 0.25
x = np.arange(-3.0, 5.0, delta)
y = np.arange(-1.3, 2.5, delta)
X, Y = np.meshgrid(x, y)
Z = (np.exp(-X**2 - Y**2) - np.exp(-(X - 1)**2 - (Y - 1)**2))

fig, ax = plt.subplots()
im = ax.imshow(Z, interpolation ='bilinear',
               origin ='lower',
               cmap ="bone",
               extent =(-3, 3, -2, 2))

levels = np.arange(-1.2, 1.6, 0.2)
CS = ax.contour(Z, levels,
                origin ='lower',
                cmap ='Greens',
                linewidths = 2,
                extent =(-3, 3, -2, 2))

zc = CS.collections[6]
plt.setp(zc, linewidth = 2)

ax.clabel(CS, levels,
          inline = 1,
          fmt ='% 1.1f',
          fontsize = 14)

plt.title('matplotlib.pyplot.contour() Example')
plt.show()
输出:

 极客教程
极客教程