matplotlib.pyplot.findobj()函数
Matplotlib是Python中一个非常棒的二维数组绘图可视化库。Matplotlib是一个基于NumPy数组构建的多平台数据可视化库,用于更广泛的SciPy堆栈。
matplotlib.pyplot.findobj()
此函数用于递归地查找Artist中包含的所有Artist的实例。创建过滤器以匹配Artist对象,该对象查找并返回匹配的Artist列表。Artist对象指的是负责在画布上渲染颜料的matplotlib.artist类的对象。
语法:matplotlib.pyplot.findobj(o=None,match=None,include_self=真)
参数:
- match:该参数用于创建过滤器,以匹配搜索的Artist对象。这可以是三种情况之一;
- None:返回Artist中的所有对象。
- 函数:带有签名的函数,如def match(artist: artist) ->布尔值。这个函数的结果有Artist,函数返回True。
- 一个类实例:它的结果包含同一个类或它的一个子类的Artist(isinstance检查),例如Line2D
- include_self:该参数接受一个布尔值,它包括自己来检查匹配列表。
返回:返回Artist列表
示例1
import matplotlib.pyplot as plt
import numpy as np


h = plt.figure()

plt.plot(range(1,11),
         range(1,11),
         gid = 'dummy_data')

legend = plt.legend(['the plotted line'])

plt.title('figure')

axis = plt.gca()
axis.set_xlim(0,5)

for p in set(h.findobj(lambda x: x.get_gid() == 'dummy_data')):
   p.set_ydata(np.ones(10)*10.0)

plt.show()
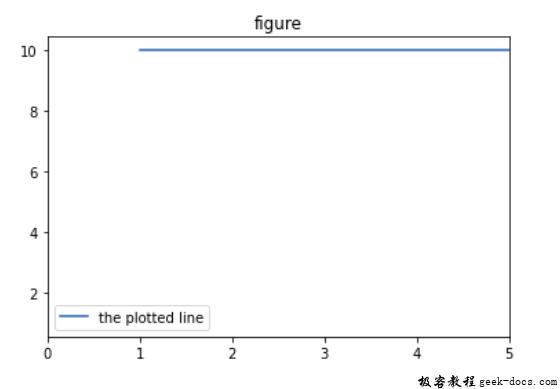
输出:

示例2
import numpy as np
import matplotlib.pyplot as plt
import matplotlib.text as text

m = np.arange(3, -4, -.2)
n = np.arange(3, -4, -.2)
o = np.exp(m)
p = o[::-1]

figure, axes = plt.subplots()
plt.plot(m, o, 'k--', m, p,
         'k:', m, o + p, 'k')

plt.legend((' Modelset', 'Dataset',
            'Total string length'),
           loc ='upper center',
           shadow = True)
plt.ylim([-1, 10])
plt.grid(True)
plt.xlabel(' Modelset --->')
plt.ylabel(' String length --->')
plt.title('Min. Length of String')


# Helper function
def find_match(x):
    return hasattr(x, 'set_color') and not hasattr(x, 'set_facecolor')

# calling the findobj function
for obj in figure.findobj(find_match):
    obj.set_color('black')

# match on class instances
for obj in figure.findobj(text.Text):
    obj.set_fontstyle('italic')


plt.show()
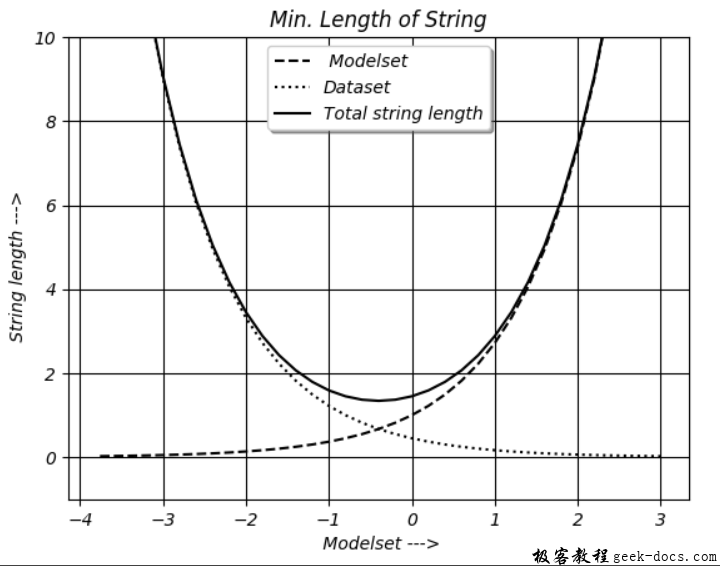
输出:

 极客教程
极客教程