matplotlib.pyplot.axhspan()函数
Matplotlib是Python中的一个库,它是NumPy库的数值-数学扩展。Pyplot是一个基于状态的Matplotlib模块接口,该模块提供了一个类似matlab的接口。
matplotlib.pyplot.axhspan()函数
matplotlib库pyplot模块中的axhspan()函数用于在轴上添加水平跨度(矩形)。
语法:matplotlib.pyplot.axhspan(ymin, ymax, xmin=0, xmax=1, **kwargs)
参数:该方法接受如下参数说明:
- ymin:设置数据单位水平跨度的下限。
- ymax:设置数据单位水平跨度的上限。
- xmin:数据单位垂直跨度的下限。
- xmax:表示数据单位垂直跨度的上限。
返回:返回多边形。
下面的例子演示了matplotlib.pyplot.axhspan()函数在matplotlib.pyplot中的作用:
示例1
import matplotlib.pyplot as plt


# xmin = 0 and xmax = 1 is the
# default value
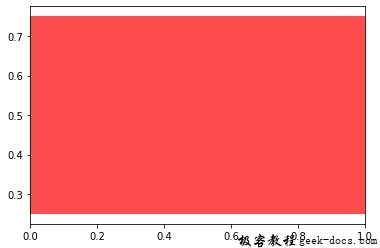
plt.axhspan(0.25, 0.75, facecolor ='r', alpha = 0.7)
输出:

示例2
#Implementation of matplotlib function
import numpy as np
import matplotlib.pyplot as plt

t = np.arange(-2, 3, .01)
s = np.sin(np.pi * t)

plt.plot(t, s, color ='black')
plt.axhline(y = 1, color ='black')

plt.axvline(x = 1, color ='black')
plt.axvline(x = 0.5, ymin = 0.75, linewidth = 8,
            color ='green')

plt.axhline(y =.5, xmin = 0.25, xmax = 0.75,
            color ='black')

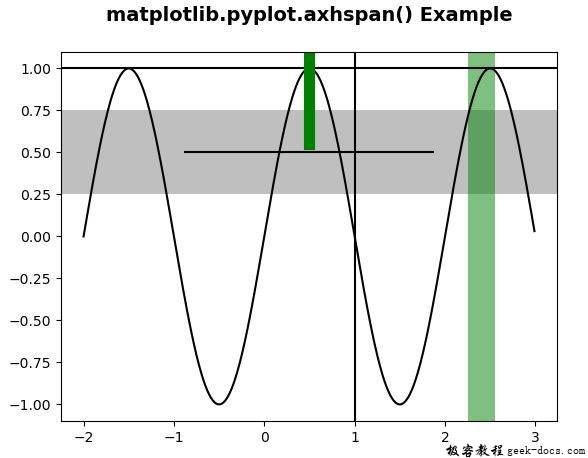
plt.axhspan(0.25, 0.75, facecolor ='0.5', alpha = 0.5)
plt.axvspan(2.25, 2.55, facecolor ='green', alpha = 0.5)

plt.title('matplotlib.pyplot.axhspan() Example\n',
          fontsize=14, fontweight='bold')

plt.show()
输出:

 极客教程
极客教程