matplotlib.pyplot.ylim()函数
matplotlib.pyplot.ylim()函数
matplotlib库pyplot模块中的ylim()函数用于获取或设置当前轴的y限制。
语法:matplotlib.pyplot.ylim (* args, * * kwargs)
参数:该方法接受如下参数说明:
- bottom:该参数用于将ylim设置为bottom。
- top:该参数用于将ylim设置为top。
- **kwargs:这个参数是Text属性,用于控制标签的外观。
返回如下内容:
- bottom, top:返回新的y轴限制的元组。
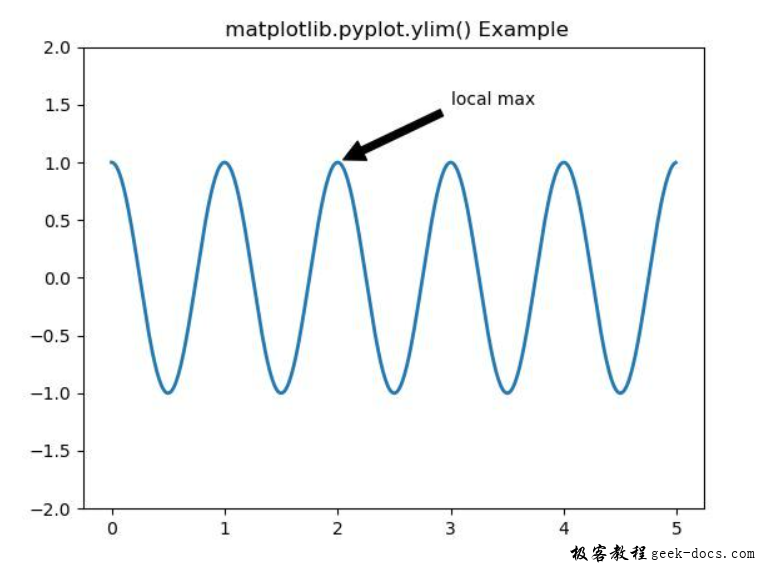
下面的例子演示了matplotlib.pyplot.ylim()函数在matplotlib.pyplot中的作用:
示例1
# Implementation of matplotlib function
import matplotlib.pyplot as plt
import numpy as np

ax = plt.subplot(111)

t = np.arange(0.0, 5.0, 0.01)
s = np.cos(2 * np.pi * t)
line, = plt.plot(t, s, lw = 2)

plt.annotate('local max', xy =(2, 1),
             xytext =(3, 1.5),
             arrowprops = dict(facecolor ='black',
                               shrink = 0.05), )

plt.ylim(-2, 2)
plt.title(" matplotlib.pyplot.ylim() Example")
plt.show()
输出:

示例2
# Implementation of matplotlib function
import matplotlib.pyplot as plt
import numpy as np

np.random.seed(9680801)

mu, sigma = 50, 13
x = mu + sigma * np.random.randn(10000)

# the histogram of the data
n, bins, patches = plt.hist(x, 50,
                            density = True,
                            facecolor ='g',
                            alpha = 0.75)


plt.xlabel('No of Users in K')
plt.title('Histogram of IQ')
plt.text(50, .035, r'\mu = 50,\
\ \sigma = 13')

plt.xlim(-10, 110)
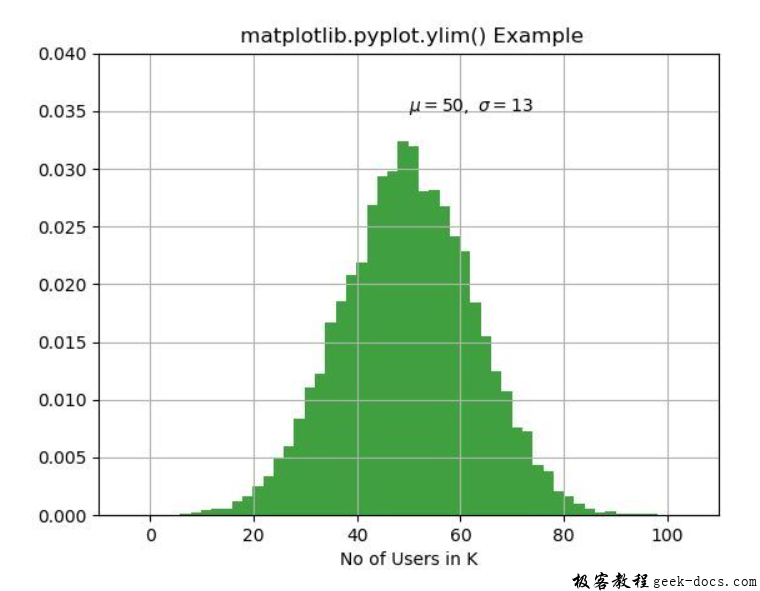
plt.ylim(0, 0.04)

plt.grid(True)
plt.title(" matplotlib.pyplot.ylim() Example")

plt.show()
输出:

 极客教程
极客教程