Matplotlib.axes.axes.set()
Matplotlib是Python中的一个库,它是NumPy库的数值-数学扩展。Axes包含了大多数图形元素:Axis、Tick、Line2D、Text、Polygon等,并设置坐标系。Axes的实例通过callbacks属性支持回调。
matplotlib.axes.axes.set()函数
matplotlib库的Axes模块中的Axes.set()函数是一个批处理属性设置器。传递kwargs来设置属性。
Axes.set(self, **kwargs)
参数:此方法不接受**kwargs以外的任何参数。
下面的例子演示了matplotlib.axes.axes.set()函数在matplotlib.axes中的作用:
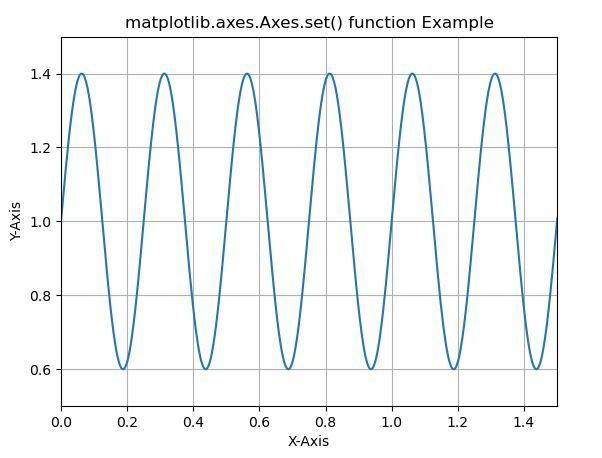
示例1
# Implementation of matplotlib function
import matplotlib
import matplotlib.pyplot as plt
import numpy as np

t = np.arange(0.0, 2, 0.001)
s = 1 + np.sin(8 * np.pi * t)*0.4

fig, ax = plt.subplots()
ax.plot(t, s)

ax.set(xlabel ='X-Axis', ylabel ='Y-Axis',
       xlim =(0, 1.5), ylim =(0.5, 1.5),
       title ='matplotlib.axes.Axes.set()\
 function Example')
ax.grid()

plt.show()
输出:

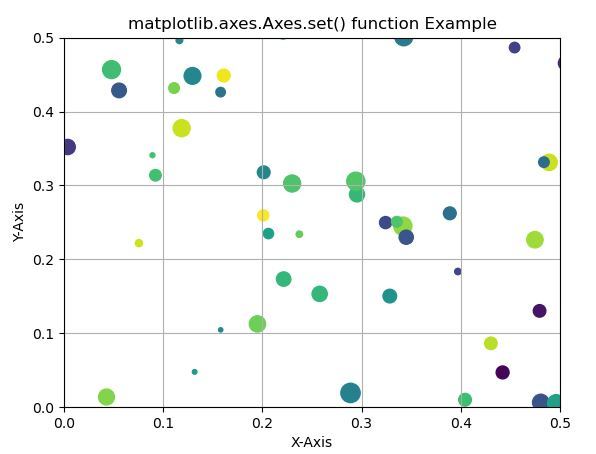
示例2
# Implementation of matplotlib function
import numpy as np
import matplotlib.pyplot as plt
np.random.seed(19680801)

fig, ax = plt.subplots()

x, y, s, c = np.random.rand(4, 200)
s *= 200

ax.scatter(x, y, s, c)

ax.set(xlabel ='X-Axis', ylabel ='Y-Axis',
       xlim =(0, 0.5), ylim =(0, 0.5),
       title ='matplotlib.axes.Axes.set()\
 function Example')
ax.grid()

plt.show()
输出:

 极客教程
极客教程