Matplotlib.axes.axes.get_tightbbox()
Matplotlib是Python中的一个库,它是NumPy库的数值-数学扩展。Axes包含了大多数图形元素:Axis、Tick、Line2D、Text、Polygon等,并设置坐标系。Axes的实例通过callbacks属性支持回调。
函数:Matplotlib.axes.axes.get_tightbbox()
matplotlib库的Axes模块中的Axes.get_tightbbox()函数用于返回轴的紧密包围框,包括轴和它们的装饰器。
语法:Axes.get_tightbbox(self, renderer, call_axes_locator=True, bbox_extra_artists=None)
参数:该方法接受以下参数。
- renderer:这个参数是RendererBase实例
- 将用于绘制图形的渲染器。
- bbox_extra_artists:该参数是要包含在紧边界框中的艺术家列表。
- call_axes_locator:该参数是要包含在紧密边界框中的艺术家列表。
返回:该方法以图像素坐标返回边界框。
下面的例子演示了matplotlib.axes.axes.get_tightbbox()函数在matplotlib.axes中的作用:
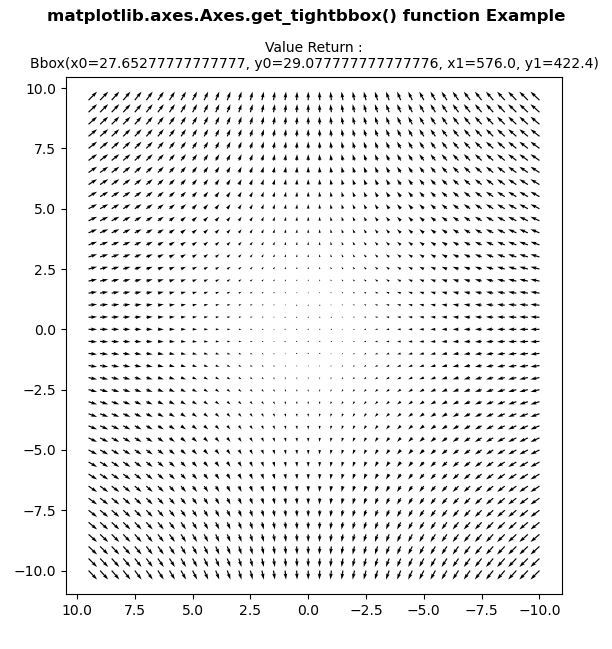
示例1
# Implementation of matplotlib function
import matplotlib.pyplot as plt
import numpy as np


X = np.arange(-10, 10, 0.5)
Y = np.arange(-10, 10, 0.5)
U, V = np.meshgrid(X, Y)

fig, ax = plt.subplots()
ax.quiver(X, Y, U, V)
ax.invert_xaxis()
w = ax.get_tightbbox(fig.canvas.get_renderer(),
                     call_axes_locator = True,
                     bbox_extra_artists = None)

ax.set_title("Value Return :\n"+str(w),
              fontsize = 10)

fig.suptitle('matplotlib.axes.Axes.get_tightbbox()\
 function Example', fontweight ="bold")

plt.show()
输出:

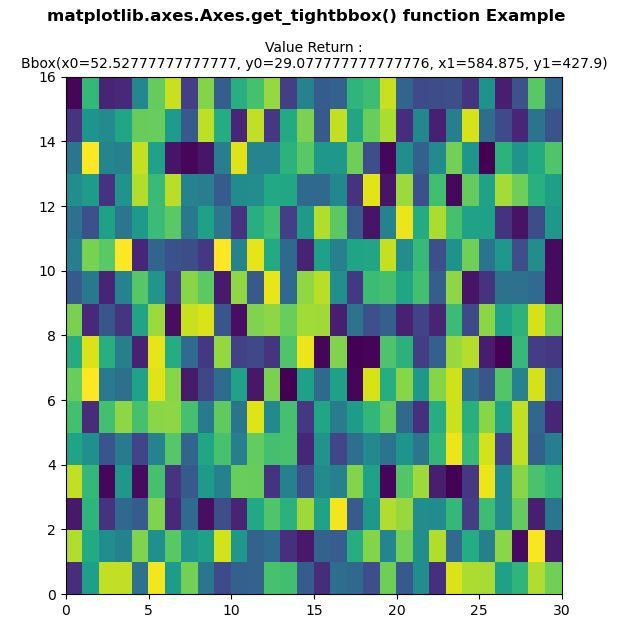
示例2
# Implementation of matplotlib function
import numpy as np
import matplotlib.pyplot as plt

xx = np.random.rand(16, 30)

fig, ax = plt.subplots()

m = ax.pcolor(xx)
m.set_zorder(-20)
w = ax.get_tightbbox(fig.canvas.get_renderer(),
                     call_axes_locator = True,
                     bbox_extra_artists = None)

ax.set_title("Value Return :\n"+str(w),
              fontsize = 10)

fig.suptitle('matplotlib.axes.Axes.get_tightbbox()\
 function Example', fontweight ="bold")

plt.show()
输出:

 极客教程
极客教程