Matplotlib.axes.axes.get_children()
Matplotlib是Python中的一个库,它是NumPy库的数值-数学扩展。Axes包含了大多数图形元素:Axis、Tick、Line2D、Text、Polygon等,并设置坐标系。Axes的实例通过callbacks属性支持回调。
函数:Matplotlib.axes.axes.get_children()
matplotlib库的Axes模块中的Axes.get_children()函数用于返回该艺术家的子艺术家列表。
语法:Axes.get_children(self)
参数:该方法不接受任何参数。
返回:该方法返回该艺术家的子艺术家列表。
下面的例子演示了matplotlib.axes.axes.get_children()函数在matplotlib.axes中的作用:
示例1
# Implementation of matplotlib function
import matplotlib.pyplot as plt
from matplotlib.lines import Line2D
import numpy as np
from numpy.random import rand


fig, ax2 = plt.subplots()

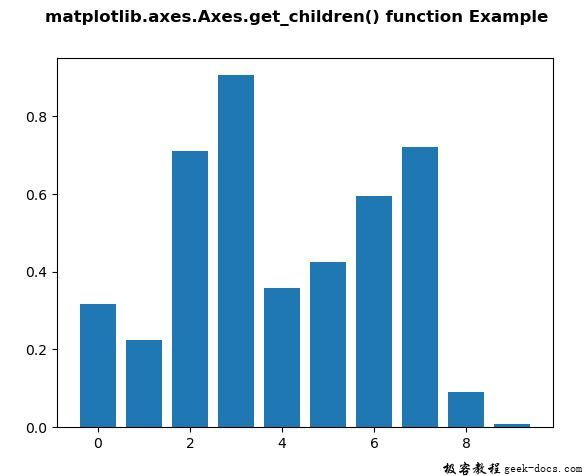
ax2.bar(range(10), rand(10), picker = True)

for label in ax2.get_xticklabels():
    label.set_picker(True)


def onpick1(event):

    if isinstance(event.artist, Line2D):
        thisline = event.artist
        xdata = thisline.get_xdata()
        ydata = thisline.get_ydata()
        ind = event.ind

        print('onpick1 line:',
              np.column_stack([xdata[ind],
                               ydata[ind]]))

    elif isinstance(event.artist, Rectangle):
        patch = event.artist
        print('onpick1 patch:', patch.get_path())

    elif isinstance(event.artist, Text):
        text = event.artist
        print('onpick1 text:', text.get_text())

print("List of the child Artists of this Artist \n",
      *list(ax2.get_children()), sep ="\n")

fig.suptitle('matplotlib.axes.Axes.get_children()\
function Example', fontweight ="bold")

plt.show()
输出:

List of the child Artists of this Artist

Rectangle(xy=(-0.4, 0), width=0.8, height=0.317575, angle=0)
Rectangle(xy=(0.6, 0), width=0.8, height=0.225129, angle=0)
Rectangle(xy=(1.6, 0), width=0.8, height=0.711747, angle=0)
Rectangle(xy=(2.6, 0), width=0.8, height=0.905822, angle=0)
Rectangle(xy=(3.6, 0), width=0.8, height=0.357726, angle=0)
Rectangle(xy=(4.6, 0), width=0.8, height=0.425352, angle=0)
Rectangle(xy=(5.6, 0), width=0.8, height=0.594905, angle=0)
Rectangle(xy=(6.6, 0), width=0.8, height=0.720468, angle=0)
Rectangle(xy=(7.6, 0), width=0.8, height=0.0908192, angle=0)
Rectangle(xy=(8.6, 0), width=0.8, height=0.00946913, angle=0)
Spine
Spine
Spine
Spine
XAxis(80.0, 52.8)
YAxis(80.0, 52.8)
Text(0.5, 1.0, '')
Text(0.0, 1.0, '')
Text(1.0, 1.0, '')
Rectangle(xy=(0, 0), width=1, height=1, angle=0)
示例2
# Implementation of matplotlib function
import matplotlib.pyplot as plt
import numpy as np
from matplotlib.patches import Ellipse


NUM = 200

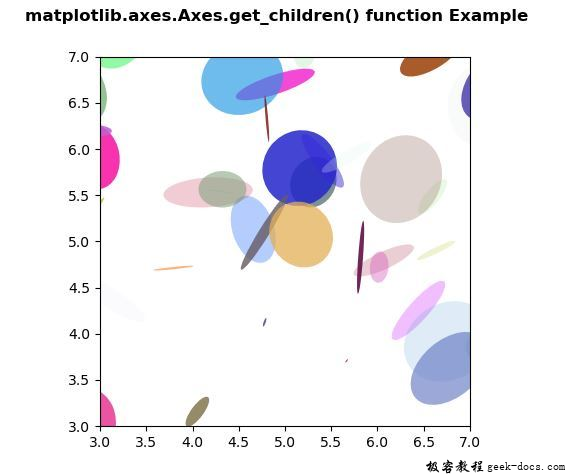
ells = [Ellipse(xy = np.random.rand(2) * 10,
                width = np.random.rand(),
                height = np.random.rand(),
                angle = np.random.rand() * 360)
        for i in range(NUM)]

fig, ax = plt.subplots(subplot_kw ={'aspect': 'equal'})

for e in ells:
    ax.add_artist(e)
    e.set_clip_box(ax.bbox)
    e.set_alpha(np.random.rand())
    e.set_facecolor(np.random.rand(4))

ax.set_xlim(3, 7)
ax.set_ylim(3, 7)

print("List of the child Artists of this Artist \n",
      *list(ax.get_children()), sep ="\n")

fig.suptitle('matplotlib.axes.Axes.get_children() \
function Example', fontweight ="bold")

plt.show()
输出:

 极客教程
极客教程