Matplotlib.axes.axes.findobj()
Matplotlib是Python中的一个库,它是NumPy库的数值-数学扩展。Axes包含了大多数图形元素:Axis、Tick、Line2D、Text、Polygon等,并设置坐标系。Axes的实例通过callbacks属性支持回调。
函数:Matplotlib.axes.axes.findobj()
matplotlib库的Axes模块中的Axes.findobj()函数用于查找艺术家对象。
语法:Axes.findobj(self, match=None,include_self=True)
参数:该方法接受以下参数。
- match:匹配的过滤条件。默认值为None。
- include_self:该参数将self包含在要检查的匹配列表中。
返回:该方法返回艺术家(艺术家列表)。
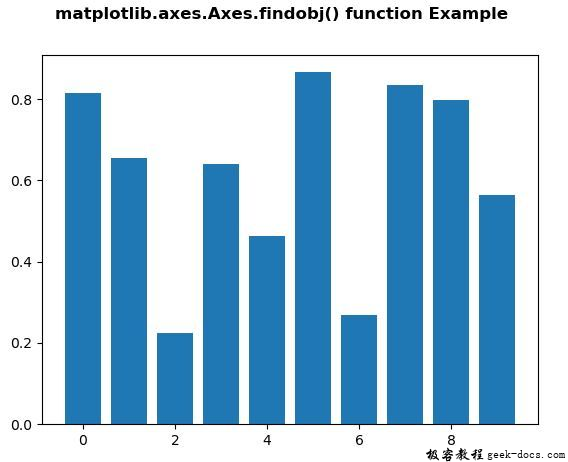
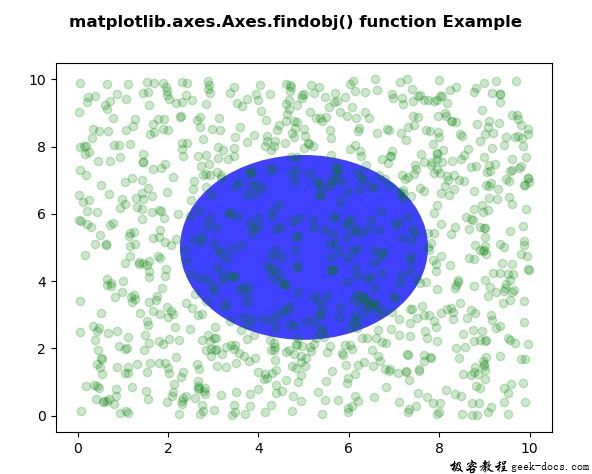
下面的例子演示了matplotlib.axes.axes.findobj()函数在matplotlib.axes中的作用:
示例1
# Implementation of matplotlib function
import matplotlib.pyplot as plt
from matplotlib.lines import Line2D
import numpy as np
from numpy.random import rand


fig, ax2 = plt.subplots()

ax2.bar(range(10), rand(10), picker = True)

for label in ax2.get_xticklabels():
    label.set_picker(True)

def onpick1(event):

    if isinstance(event.artist, Line2D):
        thisline = event.artist
        xdata = thisline.get_xdata()
        ydata = thisline.get_ydata()
        ind = event.ind
        print('onpick1 line:',
              np.column_stack([xdata[ind],
                               ydata[ind]]))

    elif isinstance(event.artist, Rectangle):
        patch = event.artist
        print('onpick1 patch:', patch.get_path())

    elif isinstance(event.artist, Text):
        text = event.artist
        print('onpick1 text:', text.get_text())

print("Value return : \n", *list(ax2.findobj()), sep ="\n")

fig.suptitle('matplotlib.axes.Axes.findobj() function Example',
             fontweight ="bold")

plt.show()
输出:

Value return :

Rectangle(xy=(-0.4, 0), width=0.8, height=0.815228, angle=0)
Rectangle(xy=(0.6, 0), width=0.8, height=0.655121, angle=0)
Rectangle(xy=(1.6, 0), width=0.8, height=0.225002, angle=0)
Rectangle(xy=(2.6, 0), width=0.8, height=0.639457, angle=0)
Rectangle(xy=(3.6, 0), width=0.8, height=0.463923, angle=0)
Rectangle(xy=(4.6, 0), width=0.8, height=0.865994, angle=0)
Rectangle(xy=(5.6, 0), width=0.8, height=0.269864, angle=0)
Rectangle(xy=(6.6, 0), width=0.8, height=0.834427, angle=0)
Rectangle(xy=(7.6, 0), width=0.8, height=0.79638, angle=0)
Rectangle(xy=(8.6, 0), width=0.8, height=0.564809, angle=0)
Spine
Spine
Spine
Spine
Text(0.5, 0, '')
Text(1, 0, '')
Line2D()
Line2D()
Line2D((0, 0), (0, 1))
Text(0, 0, '')
Text(0, 1, '')

Line2D()
Line2D()
Line2D((0, 0), (0, 1))
Text(0, 0, '')
Text(0, 1, '')

Line2D()
Line2D()
Line2D((0, 0), (0, 1))
Text(0, 0, '')
Text(0, 1, '')

Line2D()
Line2D()
Line2D((0, 0), (0, 1))
Text(0, 0, '')
Text(0, 1, '')

Line2D()
Line2D()
Line2D((0, 0), (0, 1))
Text(0, 0, '')
Text(0, 1, '')

Line2D()
Line2D()
Line2D((0, 0), (0, 1))
Text(0, 0, '')
Text(0, 1, '')

Line2D()
Line2D()
Line2D((0, 0), (0, 1))
Text(0, 0, '')
Text(0, 1, '')

XAxis(80.0, 52.8)
Text(0, 0.5, '')
Text(0, 0.5, '')
Line2D()
Line2D()
Line2D((0, 0), (1, 0))
Text(0, 0, '')
Text(1, 0, '')

Line2D()
Line2D()
Line2D((0, 0), (1, 0))
Text(0, 0, '')
Text(1, 0, '')

Line2D()
Line2D()
Line2D((0, 0), (1, 0))
Text(0, 0, '')
Text(1, 0, '')

Line2D()
Line2D()
Line2D((0, 0), (1, 0))
Text(0, 0, '')
Text(1, 0, '')

Line2D()
Line2D()
Line2D((0, 0), (1, 0))
Text(0, 0, '')
Text(1, 0, '')

Line2D()
Line2D()
Line2D((0, 0), (1, 0))
Text(0, 0, '')
Text(1, 0, '')

YAxis(80.0, 52.8)
Text(0.5, 1.0, '')
Text(0.0, 1.0, '')
Text(1.0, 1.0, '')
Rectangle(xy=(0, 0), width=1, height=1, angle=0)
AxesSubplot(0.125, 0.11;0.775x0.77)
示例2
# Implementation of matplotlib function
import numpy as np
import matplotlib.pyplot as plt
import matplotlib.patches as mpatches


fig, ax = plt.subplots()
x, y = 10 * np.random.rand(2, 1000)
ax.plot(x, y, 'go', alpha = 0.2)

circ = mpatches.Circle((0.5, 0.5), 0.25,
                       transform = ax.transAxes,
                       facecolor ='blue',
                       alpha = 0.75)
ax.add_patch(circ)

print("Value return : \n", *list(ax.findobj()),
      sep ="\n")

fig.suptitle('matplotlib.axes.Axes.findobj()\
function Example', fontweight ="bold")

plt.show()
输出:

Value return :

Circle(xy=(0.5, 0.5), radius=0.25)
Line2D(_line0)
Spine
Spine
Spine
Spine
Text(0.5, 0, '')
Text(1, 0, '')
Line2D()
Line2D()
Line2D((0, 0), (0, 1))
Text(0, 0, '')
Text(0, 1, '')

Line2D()
Line2D()
Line2D((0, 0), (0, 1))
Text(0, 0, '')
Text(0, 1, '')

Line2D()
Line2D()
Line2D((0, 0), (0, 1))
Text(0, 0, '')
Text(0, 1, '')

Line2D()
Line2D()
Line2D((0, 0), (0, 1))
Text(0, 0, '')
Text(0, 1, '')

Line2D()
Line2D()
Line2D((0, 0), (0, 1))
Text(0, 0, '')
Text(0, 1, '')

Line2D()
Line2D()
Line2D((0, 0), (0, 1))
Text(0, 0, '')
Text(0, 1, '')

Line2D()
Line2D()
Line2D((0, 0), (0, 1))
Text(0, 0, '')
Text(0, 1, '')

Line2D()
Line2D()
Line2D((0, 0), (0, 1))
Text(0, 0, '')
Text(0, 1, '')

XAxis(80.0, 52.8)
Text(0, 0.5, '')
Text(0, 0.5, '')
Line2D()
Line2D()
Line2D((0, 0), (1, 0))
Text(0, 0, '')
Text(1, 0, '')

Line2D()
Line2D()
Line2D((0, 0), (1, 0))
Text(0, 0, '')
Text(1, 0, '')

Line2D()
Line2D()
Line2D((0, 0), (1, 0))
Text(0, 0, '')
Text(1, 0, '')

Line2D()
Line2D()
Line2D((0, 0), (1, 0))
Text(0, 0, '')
Text(1, 0, '')

Line2D()
Line2D()
Line2D((0, 0), (1, 0))
Text(0, 0, '')
Text(1, 0, '')

Line2D()
Line2D()
Line2D((0, 0), (1, 0))
Text(0, 0, '')
Text(1, 0, '')

Line2D()
Line2D()
Line2D((0, 0), (1, 0))
Text(0, 0, '')
Text(1, 0, '')

Line2D()
Line2D()
Line2D((0, 0), (1, 0))
Text(0, 0, '')
Text(1, 0, '')

YAxis(80.0, 52.8)
Text(0.5, 1.0, '')
Text(0.0, 1.0, '')
Text(1.0, 1.0, '')
Rectangle(xy=(0, 0), width=1, height=1, angle=0)
AxesSubplot(0.125, 0.11;0.775x0.77)
 极客教程
极客教程