Matplotlib.axes.axes.end_pan()
Matplotlib是Python中的一个库,它是NumPy库的数值-数学扩展。Axes包含了大多数图形元素:Axis、Tick、Line2D、Text、Polygon等,并设置坐标系。Axes的实例通过callbacks属性支持回调。
Matplotlib.axes.axes.end_pan()函数
当平移操作完成时,matplotlib库的Axes模块中的Axes.end_pan()函数被调用。
Axes.drag_pan(self, button, key, x, y)
参数:该方法不接受任何参数。
Returns:该方法不返回任何值。
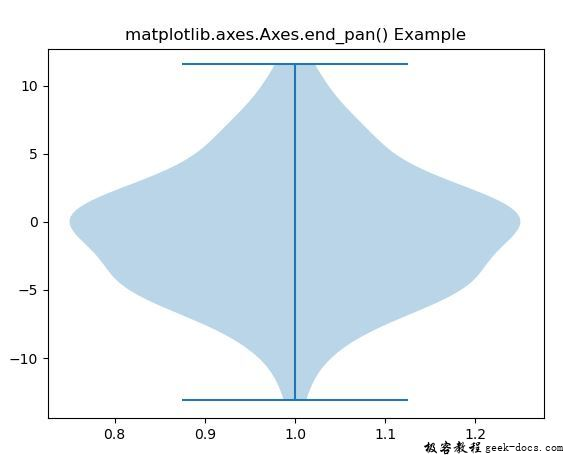
下面的例子演示了matplotlib.axes.axes.end_pan()函数在matplotlib.axes中的作用:
示例1
# Implementation of matplotlib function
import matplotlib.pyplot as plt
import numpy as np


np.random.seed(10**7)
data = np.random.normal(0, 5, 100)

fig, ax1 = plt.subplots()
val = ax1.violinplot(data)

ax1.start_pan(1, 0, 3)
ax1.drag_pan(1, "shift", 0, 0.6)
ax1.end_pan()

ax1.set_title('matplotlib.axes.Axes.end_pan() \
Example')

plt.show()
输出:

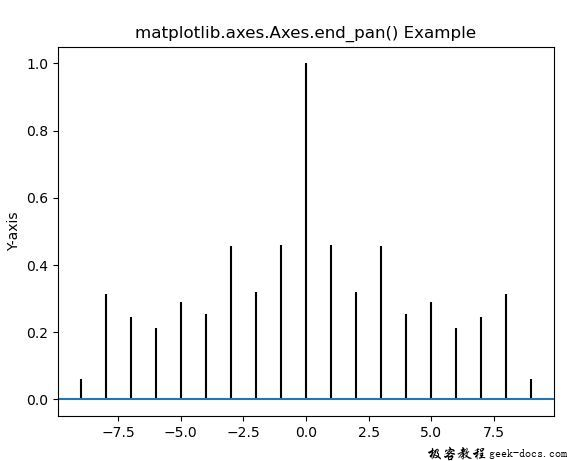
示例2
# Implementation of matplotlib function
import matplotlib.pyplot as plt
import numpy as np


geeks = np.array([24.40, 110.25,
                  20.05, 22.00,
                  61.90, 7.80,
                  15.00, 22.80,
                  34.90, 57.30])

fig, ax = plt.subplots()
ax.acorr(geeks, maxlags = 9)

ax.set_ylabel('Y-axis')
ax.start_pan(0, 0.6, 1)
ax.drag_pan(1, "shift", 0, 0.6)
ax.end_pan()

ax.set_title('matplotlib.axes.Axes.end_pan()\
Example')

plt.show()
输出:

 极客教程
极客教程