Matplotlib.axes.axes.get_data_ratio()
Matplotlib是Python中的一个库,它是NumPy库的数值-数学扩展。Axes包含了大多数图形元素:Axis、Tick、Line2D、Text、Polygon等,并设置坐标系。Axes的实例通过callbacks属性支持回调。
函数Matplotlib.axes.axes.get_data_ratio()
matplotlib库的Axes模块中的Axes.get_data_ratio()函数用于获取原始数据的长宽比。
语法:Axes.get_data_ratio(self)
参数:该方法不接受任何参数。
返回:该方法返回原始数据的纵横比。
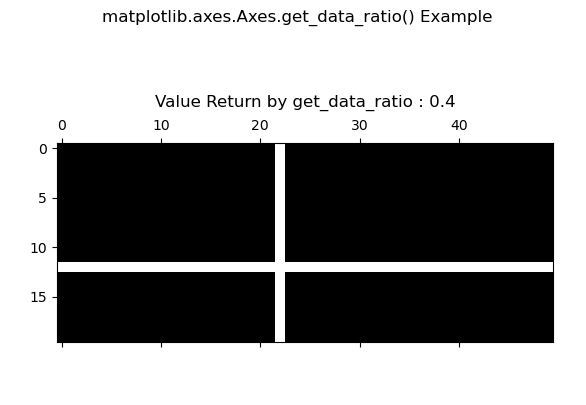
下面的例子演示了matplotlib.axes.axes.get_data_ratio()函数在matplotlib.axes中的作用:
示例1
# Implementation of matplotlib function
import matplotlib.pyplot as plt
import numpy as np

fig, ax1 = plt.subplots()

x = np.random.randn(20, 50)
x[12, :] = 0.
x[:, 22] = 0.

ax1.spy(x)
ax1.set_title("Value Return by get_data_ratio : "
              +str(ax1.get_data_ratio())+"\n")

fig.suptitle('matplotlib.axes.Axes.get_data_ratio() \
Example')

plt.show()
输出:

示例2
# Implementation of matplotlib function
import matplotlib.pyplot as plt
import numpy as np

fig, [(ax1, ax2), (ax3, ax4)] = plt.subplots(2, 2)

x = np.random.randn(20, 50)
x[5, :] = 0.
x[:, 12] = 0.

ax1.spy(x, markersize = 4)
ax2.spy(x, precision = 0.2, markersize = 4)

ax3.spy(x)
ax4.spy(x, precision = 0.4)

ax1.set_title("Value Return by get_data_ratio : "
              +str(ax1.get_data_ratio())+"\n")


ax2.set_title("Value Return by get_data_ratio : "
              +str(ax2.get_data_ratio())+"\n")

ax3.set_title("Value Return by get_data_ratio : "
              +str(ax3.get_data_ratio())+"\n")

ax4.set_title("Value Return by get_data_ratio : "
              +str(ax4.get_data_ratio())+"\n")

fig.suptitle('matplotlib.axes.Axes.get_data_ratio\
 Example')

plt.show()
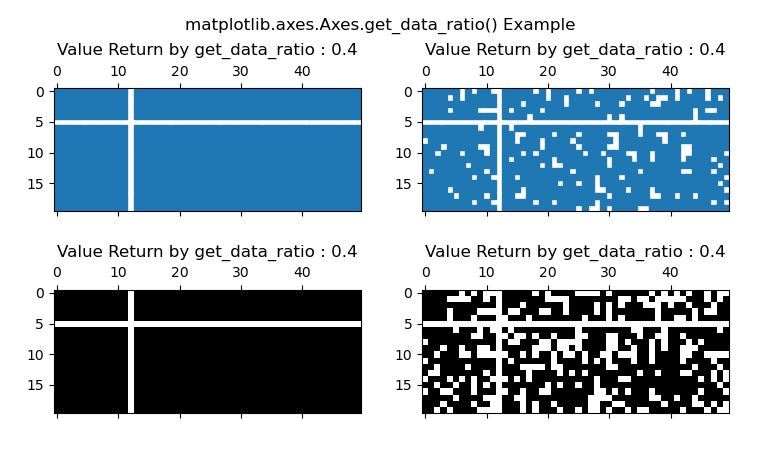
输出:

 极客教程
极客教程