matplotlib.pyplot.get_figlabels()函数
Matplotlib是Python中的一个库,它是NumPy库的数值-数学扩展。Pyplot是一个基于状态的Matplotlib模块接口,该模块提供了一个类似matlab的接口。Pyplot中可以使用的绘图有直线图、轮廓图、直方图、散点图、三维图等。
matplotlib.pyplot.get_figlabels()方法
使用matplotlib库pyplot模块中的get_figlabels()方法获取现有的图形标签列表。
语法:matplotlib.pyplot.get_figlabels ()
参数:此方法不接受任何参数。
返回:此方法返回现有图形标签的列表。
下面的例子演示了matplotlib.pyplot.get_figlabels()函数在matplotlib.pyplot中的作用:
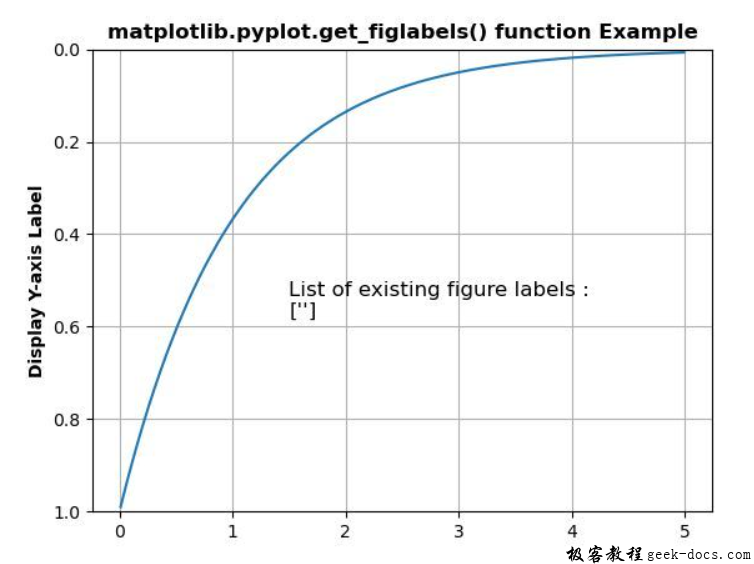
示例1
import matplotlib.pyplot as plt
import numpy as np


t = np.arange(0.01, 5.0, 0.01)
s = np.exp(-t)

plt.plot(t, s)
plt.ylim(1, 0)
plt.ylabel('Display Y-axis Label', fontweight ='bold')
plt.grid(True)

w = plt.get_figlabels()

plt.text(1.5, 0.58,
         "List of existing figure labels : \n"
         + str(w),
         fontsize = 12)

plt.title('matplotlib.pyplot.get_figlabels() function\
 Example', fontweight ="bold")

plt.show()
输出:

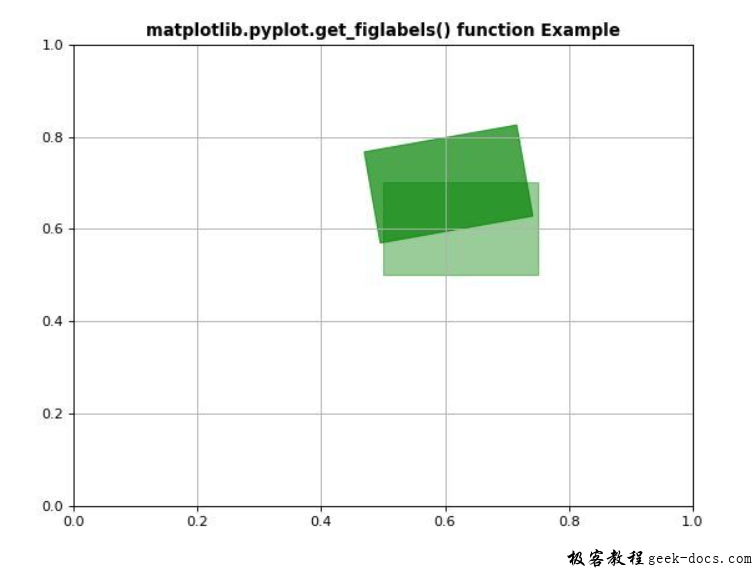
示例2
import matplotlib.pyplot as plt
import matplotlib as mpl
import matplotlib.patches as patches
import numpy as np


mpl.rcParams['figure.dpi'] = 80
mpl.rcParams['savefig.dpi'] = 80

def redraw(event):

    if  np.size(plt.get_figlabels()):
        ax.clear()
        drawRectangles(ax)
        fig.canvas.draw()
    else:
        pass


def drawRectangles(ax):

    td2dis = ax.transData
    coords = td2dis.transform([0.2, 0.5])
    tr = mpl.transforms.Affine2D().rotate_deg_around(coords[0],
                                                     coords[1], 10)
    t = td2dis + tr
    rec0 = patches.Rectangle((0.5, 0.5),
                             0.25, 0.2,
                             color = 'green',
                             alpha = 0.4)
    ax.add_patch(rec0)
    rect1 = patches.Rectangle((0.5, 0.5),
                              0.25, 0.2,
                              color = 'green',
                              alpha = 0.7,
                              transform = t)
    ax.add_patch(rect1);
    plt.title('matplotlib.pyplot.get_figlabels() function Example', fontweight ="bold")
    plt.grid()


figSize = (8, 6)
fig = plt.figure("Patch rotate", figsize = figSize)

ax = fig.add_subplot(111)
ax.set_xlim(0, 1);ax.set_ylim(0, 1);

fig.canvas.mpl_connect('resize_event', redraw)
drawRectangles(ax)

plt.show()
输出:

 极客教程
极客教程