方向梯度直方图(HOG)第二步:梯度直方图
在这里完成 HOG 的第4步。
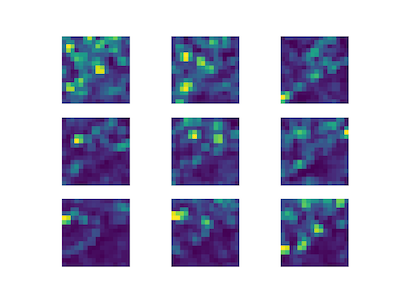
取N=8,8 \times 8个像素为一个 cell,将每个 cell 的梯度幅值加到梯度方向的index处。
解答为按照下面的顺序排列索引对应的直方图:
\begin{matrix}
1&2& 3\\
4& 5& 6\\
7& 8 &9
\end{matrix}
python实现:
import cv2
import numpy as np
import matplotlib.pyplot as plt

# get HOG step2
def HOG_step2(img):
    # Grayscale
    def BGR2GRAY(img):
        gray = 0.2126 * img[..., 2] + 0.7152 * img[..., 1] + 0.0722 * img[..., 0]
        return gray

    # Magnitude and gradient
    def get_gradXY(gray):
        H, W = gray.shape

        # padding before grad
        gray = np.pad(gray, (1, 1), 'edge')

        # get grad x
        gx = gray[1:H+1, 2:] - gray[1:H+1, :W]
        # get grad y
        gy = gray[2:, 1:W+1] - gray[:H, 1:W+1]
        # replace 0 with
        gx[gx == 0] = 1e-6

        return gx, gy

    # get magnitude and gradient
    def get_MagGrad(gx, gy):
        # get gradient maginitude
        magnitude = np.sqrt(gx ** 2 + gy ** 2)

        # get gradient angle
        gradient = np.arctan(gy / gx)

        gradient[gradient < 0] = np.pi / 2 + gradient[gradient < 0] + np.pi / 2

        return magnitude, gradient

    # Gradient histogram
    def quantization(gradient):
        # prepare quantization table
        gradient_quantized = np.zeros_like(gradient, dtype=np.int)

        # quantization base
        d = np.pi / 9

        # quantization
        for i in range(9):
            gradient_quantized[np.where((gradient >= d * i) & (gradient <= d * (i + 1)))] = i

        return gradient_quantized


    # get gradient histogram
    def gradient_histogram(gradient_quantized, magnitude, N=8):
        # get shape
        H, W = magnitude.shape

        # get cell num
        cell_N_H = H // N
        cell_N_W = W // N
        histogram = np.zeros((cell_N_H, cell_N_W, 9), dtype=np.float32)

        # each pixel
        for y in range(cell_N_H):
            for x in range(cell_N_W):
                for j in range(N):
                    for i in range(N):
                        histogram[y, x, gradient_quantized[y * 4 + j, x * 4 + i]] += magnitude[y * 4 + j, x * 4 + i]

        return histogram

    # 1. BGR -> Gray
    gray = BGR2GRAY(img)

    # 1. Gray -> Gradient x and y
    gx, gy = get_gradXY(gray)

    # 2. get gradient magnitude and angle
    magnitude, gradient = get_MagGrad(gx, gy)

    # 3. Quantization
    gradient_quantized = quantization(gradient)

    # 4. Gradient histogram
    histogram = gradient_histogram(gradient_quantized, magnitude)

    return histogram


# Read image
img = cv2.imread("imori.jpg").astype(np.float32)

# get HOG step2
histogram = HOG_step2(img)

# write histogram to file
for i in range(9):
    plt.subplot(3,3,i+1)
    plt.imshow(histogram[..., i])
    plt.axis('off')
    plt.xticks(color="None")
    plt.yticks(color="None")
plt.savefig("out.png")
plt.show()
输入(imori.jpg):

输出: