Matplotlib 文本旋转:如何灵活调整图表中的文字方向
Matplotlib 是 Python 中最流行的数据可视化库之一,它提供了丰富的功能来创建各种类型的图表和绘图。在数据可视化中,文本标签的清晰度和可读性至关重要。有时,为了避免标签重叠或更好地利用空间,我们需要旋转文本。本文将深入探讨 Matplotlib 中的文本旋转技术,帮助你创建更加清晰、美观的图表。
1. 文本旋转的基础知识
在 Matplotlib 中,文本旋转是通过设置 rotation 参数来实现的。这个参数可以应用于多种文本元素,如轴标签、刻度标签和普通文本。
1.1 基本的文本旋转
让我们从一个简单的例子开始,展示如何旋转 x 轴的刻度标签:
import matplotlib.pyplot as plt
import numpy as np

x = np.arange(5)
y = [2, 4, 1, 5, 3]

plt.figure(figsize=(8, 6))
plt.bar(x, y)
plt.xticks(x, ['How2matplotlib.com A', 'How2matplotlib.com B', 'How2matplotlib.com C', 'How2matplotlib.com D', 'How2matplotlib.com E'], rotation=45)
plt.title('Basic Text Rotation Example')
plt.tight_layout()
plt.show()
Output:
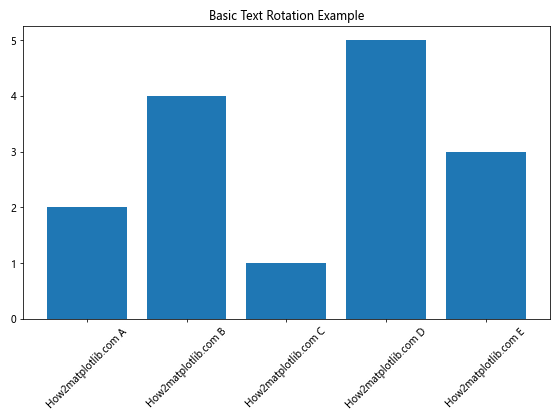
在这个例子中,我们创建了一个简单的条形图,并使用 plt.xticks() 函数来设置 x 轴的刻度标签。通过设置 rotation=45,我们将标签旋转了 45 度。这样可以有效避免长标签之间的重叠。
1.2 使用不同的旋转角度
rotation 参数可以接受不同类型的值:
- 整数或浮点数:表示旋转的角度(以度为单位)
- ‘vertical’:垂直放置文本(等同于 90 度)
- ‘horizontal’:水平放置文本(等同于 0 度)
让我们看一个使用不同旋转角度的例子:
import matplotlib.pyplot as plt
import numpy as np

x = np.arange(4)
y = [3, 1, 4, 2]

plt.figure(figsize=(12, 8))
plt.bar(x, y)
plt.xticks(x, ['How2matplotlib.com A', 'How2matplotlib.com B', 'How2matplotlib.com C', 'How2matplotlib.com D'])

# 旋转不同角度的标签
angles = [0, 30, 60, 90]
for i, angle in enumerate(angles):
    plt.text(i, y[i], f'Rotation: {angle}°', rotation=angle, ha='center', va='bottom')

plt.title('Different Text Rotation Angles')
plt.tight_layout()
plt.show()
Output:
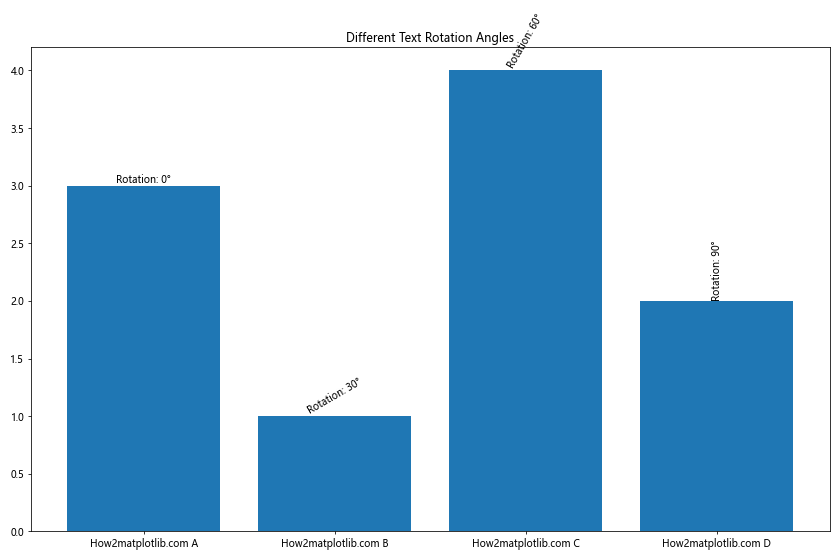
这个例子展示了如何在条形图上方添加不同角度旋转的文本标签。我们使用 plt.text() 函数来添加文本,并为每个文本设置不同的旋转角度。
2. 旋转轴标签
除了刻度标签,我们还经常需要旋转轴标签,特别是 y 轴标签。
2.1 旋转 x 轴和 y 轴标签
下面是一个同时旋转 x 轴和 y 轴标签的例子:
import matplotlib.pyplot as plt
import numpy as np

x = np.linspace(0, 10, 100)
y = np.sin(x)

plt.figure(figsize=(10, 6))
plt.plot(x, y)

plt.xlabel('How2matplotlib.com X-axis', rotation=15)
plt.ylabel('How2matplotlib.com Y-axis', rotation=0)

plt.title('Rotated Axis Labels')
plt.tight_layout()
plt.show()
Output:
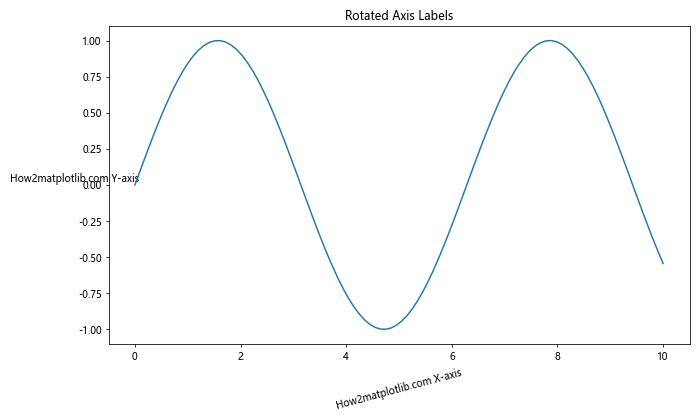
在这个例子中,我们将 x 轴标签旋转了 15 度,而 y 轴标签则保持水平(rotation=0)。这种方式可以在不影响可读性的情况下,为图表增添一些视觉趣味。
2.2 调整旋转标签的对齐方式
当旋转标签时,有时需要调整其对齐方式以获得最佳的视觉效果。我们可以使用 ha(水平对齐)和 va(垂直对齐)参数来实现这一点:
import matplotlib.pyplot as plt
import numpy as np

x = np.arange(5)
y = [2, 4, 1, 5, 3]

plt.figure(figsize=(10, 6))
plt.bar(x, y)

plt.xticks(x, ['How2matplotlib.com A', 'How2matplotlib.com B', 'How2matplotlib.com C', 'How2matplotlib.com D', 'How2matplotlib.com E'],
           rotation=45, ha='right', va='top')

plt.xlabel('Categories', rotation=0)
plt.ylabel('Values', rotation=90)

plt.title('Adjusted Alignment for Rotated Labels')
plt.tight_layout()
plt.show()
Output:
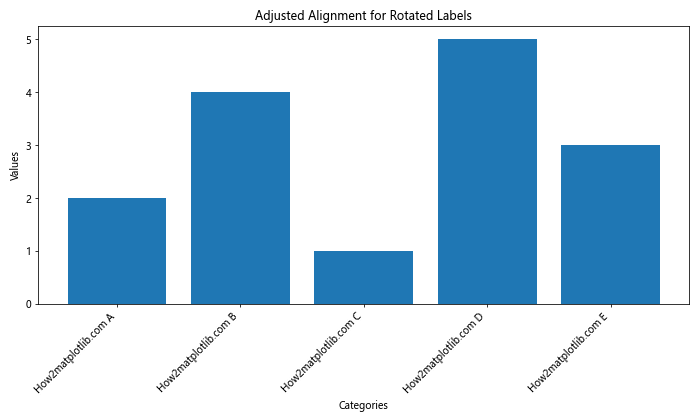
在这个例子中,我们将 x 轴的刻度标签旋转 45 度,并将其水平对齐方式设置为右对齐(ha='right'),垂直对齐方式设置为顶部对齐(va='top')。这样可以使旋转后的标签看起来更加整齐。
3. 在图表中旋转文本
除了轴标签和刻度标签,我们还可以在图表的任何位置添加旋转的文本。
3.1 使用 plt.text() 添加旋转文本
plt.text() 函数允许我们在图表的任意位置添加文本,并可以轻松地旋转它:
import matplotlib.pyplot as plt
import numpy as np

x = np.linspace(0, 10, 100)
y = np.sin(x)

plt.figure(figsize=(10, 6))
plt.plot(x, y)

plt.text(5, 0.5, 'How2matplotlib.com\nRotated Text', rotation=30,
         fontsize=12, ha='center', va='center',
         bbox=dict(facecolor='white', edgecolor='black', alpha=0.7))

plt.title('Adding Rotated Text to Plot')
plt.tight_layout()
plt.show()
Output:
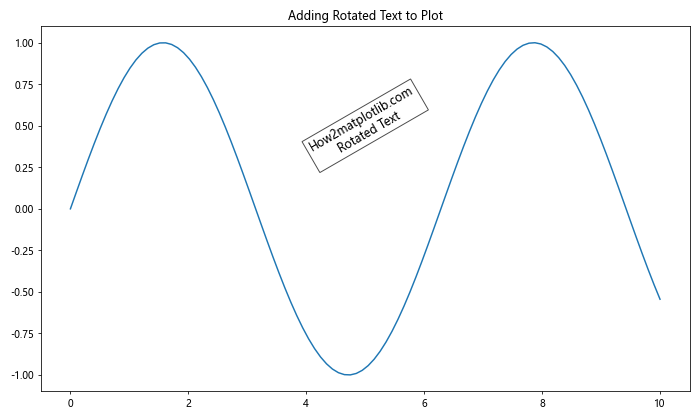
这个例子展示了如何在正弦波图上添加一个旋转 30 度的文本框。我们使用 bbox 参数为文本添加了一个背景框,使其更加突出。
3.2 旋转图例文本
有时,我们可能需要旋转图例中的文本。虽然 Matplotlib 不直接提供旋转图例文本的选项,但我们可以通过自定义图例来实现这一点:
import matplotlib.pyplot as plt
import numpy as np

x = np.linspace(0, 10, 100)
y1 = np.sin(x)
y2 = np.cos(x)

plt.figure(figsize=(10, 6))
plt.plot(x, y1, label='How2matplotlib.com Sin')
plt.plot(x, y2, label='How2matplotlib.com Cos')

# 创建自定义图例
legend = plt.legend(loc='upper right')
for text in legend.get_texts():
    text.set_rotation(45)

plt.title('Rotated Legend Text')
plt.tight_layout()
plt.show()
Output:
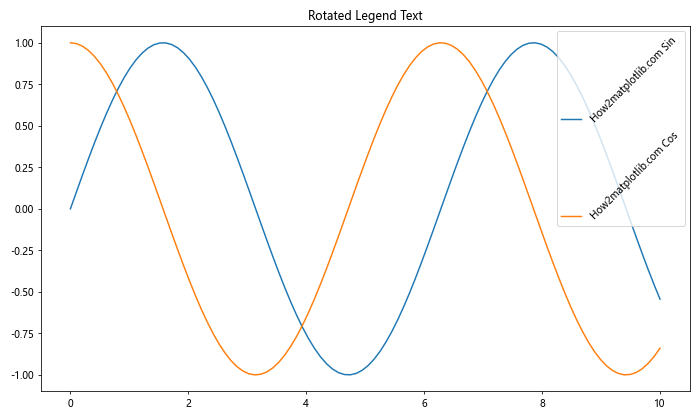
在这个例子中,我们首先创建了一个普通的图例,然后遍历图例中的所有文本元素,并将它们旋转 45 度。这种方法可以让你灵活地控制图例文本的旋转。
4. 高级文本旋转技巧
随着我们对 Matplotlib 文本旋转的理解加深,我们可以尝试一些更高级的技巧来增强图表的可读性和美观性。
4.1 动态调整旋转角度
在某些情况下,我们可能需要根据数据动态调整文本的旋转角度。例如,在散点图中,我们可以根据点的位置来旋转标签:
import matplotlib.pyplot as plt
import numpy as np

np.random.seed(42)
x = np.random.rand(20)
y = np.random.rand(20)
labels = [f'How2matplotlib.com Point {i}' for i in range(20)]

plt.figure(figsize=(10, 8))
plt.scatter(x, y)

for i, (xi, yi, label) in enumerate(zip(x, y, labels)):
    angle = np.degrees(np.arctan2(yi - 0.5, xi - 0.5))
    plt.annotate(label, (xi, yi), rotation=angle,
                 xytext=(5, 5), textcoords='offset points',
                 ha='left', va='bottom')

plt.title('Dynamic Text Rotation in Scatter Plot')
plt.xlim(0, 1)
plt.ylim(0, 1)
plt.tight_layout()
plt.show()
Output:
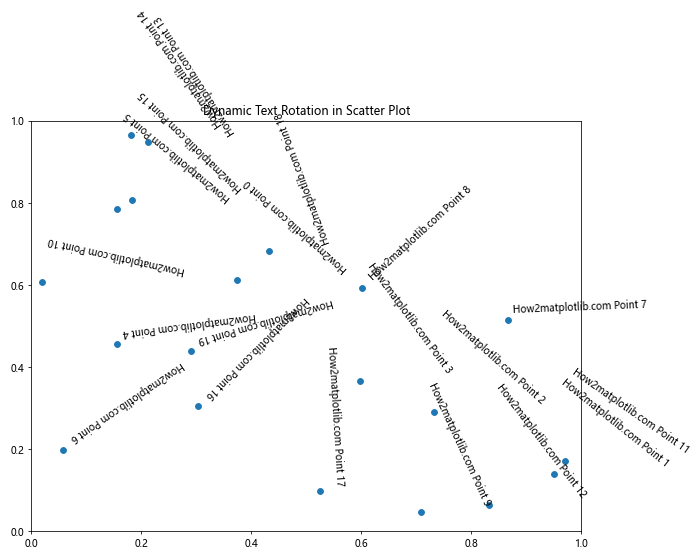
在这个例子中,我们创建了一个散点图,并为每个点添加了一个标签。标签的旋转角度是根据点相对于图表中心的位置动态计算的。这种方法可以使标签更好地跟随数据点的分布。
4.2 使用 transform 旋转文本
Matplotlib 的 transform 系统提供了更高级的文本旋转方法。我们可以使用它来创建相对于坐标系统旋转的文本:
import matplotlib.pyplot as plt
import numpy as np

fig, ax = plt.subplots(figsize=(10, 6))

# 绘制一些数据
x = np.linspace(0, 10, 100)
y = np.sin(x)
ax.plot(x, y)

# 添加旋转的文本,使用 transform
ax.text(0.5, 0.5, 'How2matplotlib.com\nTransformed Rotation',
        rotation=30,
        transform=ax.transAxes,
        fontsize=12, ha='center', va='center',
        bbox=dict(facecolor='white', edgecolor='black', alpha=0.7))

ax.set_title('Text Rotation with Transform')
plt.tight_layout()
plt.show()
Output:
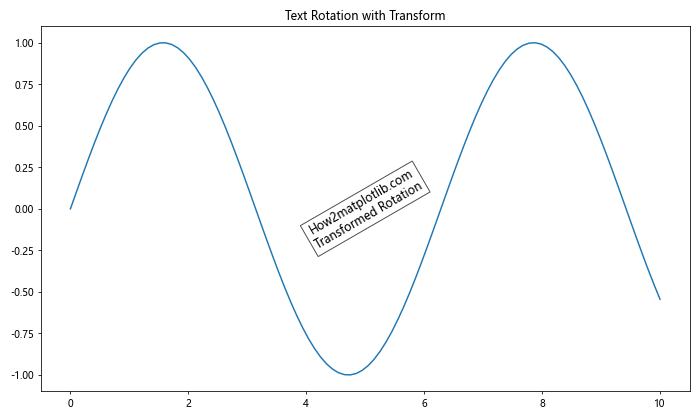
在这个例子中,我们使用 ax.transAxes 变换将文本放置在轴的相对坐标系中。这意味着无论图表的大小如何变化,文本都会保持在相同的相对位置。
4.3 创建圆形文本
有时,我们可能需要创建沿着圆形路径排列的文本。虽然这不是严格意义上的旋转,但它涉及到类似的概念:
import matplotlib.pyplot as plt
import numpy as np

fig, ax = plt.subplots(figsize=(10, 10))

# 创建一个圆
circle = plt.Circle((0.5, 0.5), 0.4, fill=False)
ax.add_artist(circle)

# 添加圆形文本
text = "How2matplotlib.com - Creating Circular Text in Matplotlib"
theta = np.linspace(0, 2*np.pi, len(text) + 1)[:-1]
x = 0.5 + 0.4 * np.cos(theta)
y = 0.5 + 0.4 * np.sin(theta)

for i, (xi, yi, char) in enumerate(zip(x, y, text)):
    ax.text(xi, yi, char, rotation=np.degrees(-theta[i]) + 90,
            ha='center', va='center', fontsize=12)

ax.set_xlim(0, 1)
ax.set_ylim(0, 1)
ax.axis('off')
plt.title('Circular Text in Matplotlib')
plt.tight_layout()
plt.show()
Output:
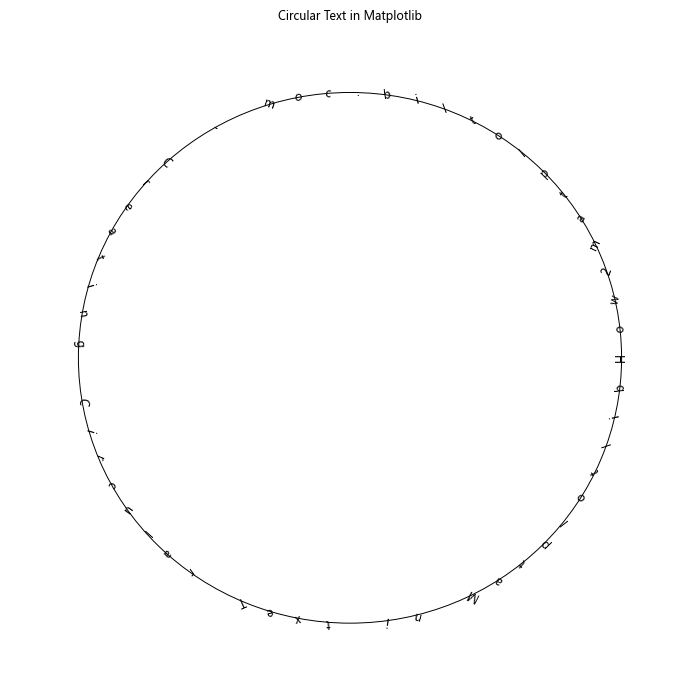
这个例子展示了如何创建一个圆形排列的文本。我们计算了圆周上的点,并在每个点放置一个字符,同时旋转每个字符以使其切线于圆。
5. 处理长文本和多行文本的旋转
在实际应用中,我们经常需要处理长文本或多行文本的旋转。这些情况需要特别注意,以确保文本的可读性和美观性。
5.1 旋转长文本
当处理长文本时,简单的旋转可能会导致文本超出图表边界。我们可以通过调整文本位置和使用换行来解决这个问题:
import matplotlib.pyplot as plt
import textwrap

plt.figure(figsize=(12, 8))

long_text = "How2matplotlib.com presents a very long text that needs to be rotated and wrapped properly to fit within the plot area"
wrapped_text = textwrap.fill(long_text, width=20)

plt.text(0.5, 0.5, wrapped_text,
         rotation=45,
         ha='center', va='center',
         fontsize=12,
         bbox=dict(facecolor='white', edgecolor='black', alpha=0.7))

plt.xlim(0, 1)
plt.ylim(0, 1)
plt.title('Rotating Long Text')
plt.axis('off')
plt.tight_layout()
plt.show()
Output:
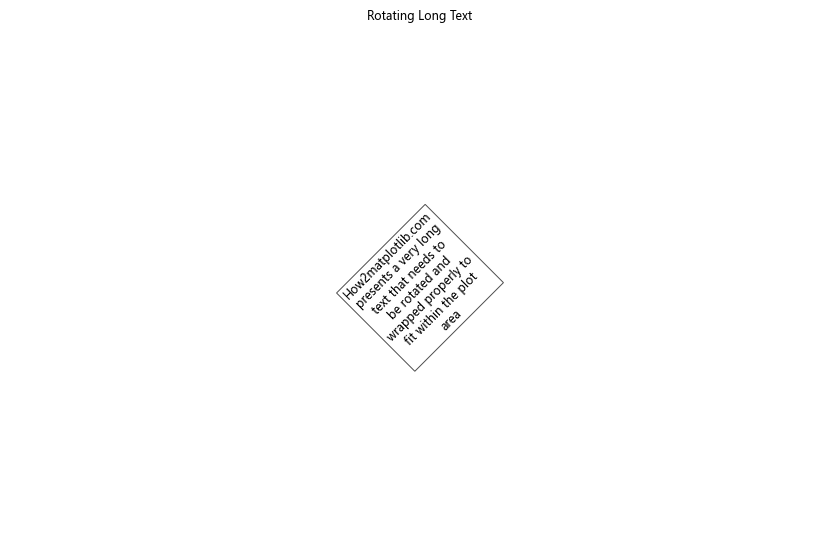
在这个例子中,我们使用 textwrap.fill() 函数将长文本分成多行,然后旋转整个文本块。这种方法可以确保长文本在旋转后仍然保持在图表的可见区域内。
5.2 旋转多行文本
对于多行文本,我们需要考虑每行文本的对齐方式:
import matplotlib.pyplot as plt

plt.figure(figsize=(10, 8))

multiline_text = "How2matplotlib.com\nMulti-line\nRotated Text\nExample"

plt.text(0.5, 0.5, multiline_text,
         rotation=30,
         ha='center', va='center',
         fontsize=12, linespacing=1.5,
         bbox=dict(facecolor='white', edgecolor='black', alpha=0.7))

plt.xlim(0, 1)
plt.ylim(0, 1)
plt.title('Rotating Multi-line Text')
plt.axis('off')
plt.tight_layout()
plt.show()
Output:
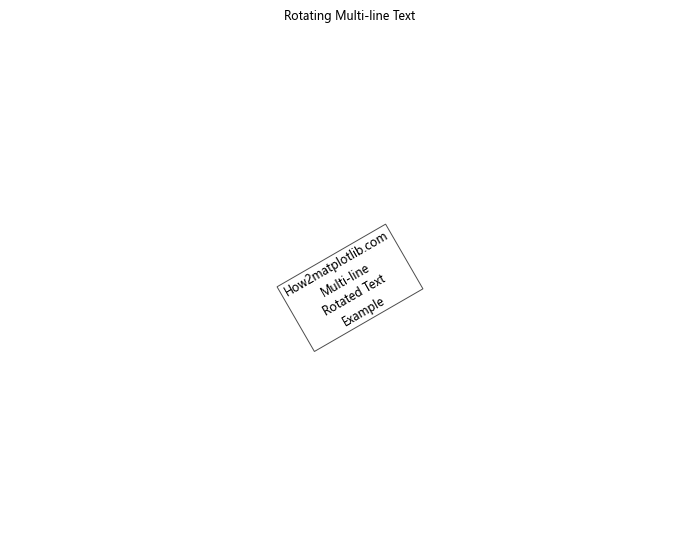
在这个例子中,我们使用 \n 来创建多行文本,并通过 linespacing 参数调整行间距。旋转后的多行文本会作为一个整体进行旋转,保持其内部结构。
6. 在不同类型的图表中应用文本旋转
文本旋转技术可以应用于各种类型的图表,每种图表可能有其特定的需求和挑战。让我们看看如何在不同类型的图表中应用文本旋转。
6.1 在条形图中旋转标签
在条形图中,当类别标签较长时,旋转标签是一种常见的做法:
import matplotlib.pyplot as plt
import numpy as np

categories = ['How2matplotlib.com A', 'How2matplotlib.com B', 'How2matplotlib.com C', 'How2matplotlib.com D', 'How2matplotlib.com E']
values = [23, 45, 56, 78, 32]

plt.figure(figsize=(12, 6))
bars = plt.bar(categories, values)

plt.xticks(rotation=45, ha='right')
plt.ylabel('Values')
plt.title('Bar Chart with Rotated Labels')

# 在每个条形上方添加数值标签
for bar in bars:
    height = bar.get_height()
    plt.text(bar.get_x() + bar.get_width()/2., height,
             f'{height}',
             ha='center', va='bottom', rotation=0)

plt.tight_layout()
plt.show()
Output:
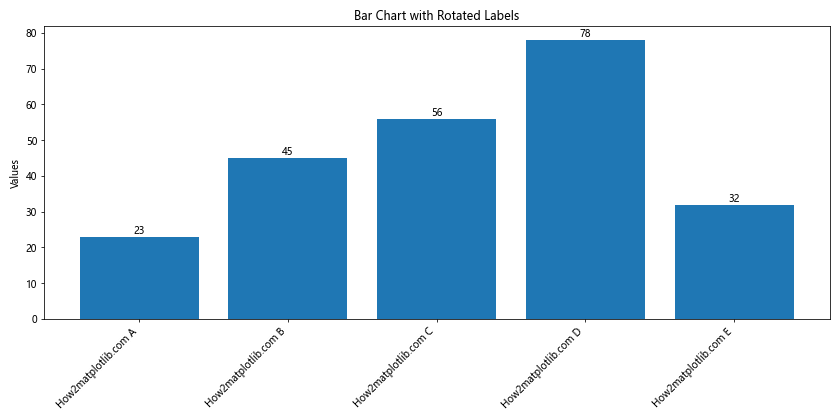
这个例子展示了如何在条形图中旋转 x 轴标签,并在每个条形上方添加垂直的数值标签。
6.2 在饼图中旋转标签
在饼图中,我们可能需要旋转标签以使其与饼图的扇形对齐:
import matplotlib.pyplot as plt

sizes = [15, 30, 45, 10]
labels = ['How2matplotlib.com A', 'How2matplotlib.com B', 'How2matplotlib.com C', 'How2matplotlib.com D']
colors = ['gold', 'yellowgreen', 'lightcoral', 'lightskyblue']

plt.figure(figsize=(10, 10))
wedges, texts, autotexts = plt.pie(sizes, labels=labels, colors=colors, autopct='%1.1f%%', startangle=90)

# 旋转标签
for i, text in enumerate(texts):
    angle = (wedges[i].theta2 + wedges[i].theta1) / 2
    text.set_rotation(angle)
    if angle > 90 and angle < 270:
        text.set_rotation(angle + 180)
        text.set_ha('right')
    else:
        text.set_ha('left')

plt.title('Pie Chart with Rotated Labels')
plt.axis('equal')
plt.tight_layout()
plt.show()
Output:
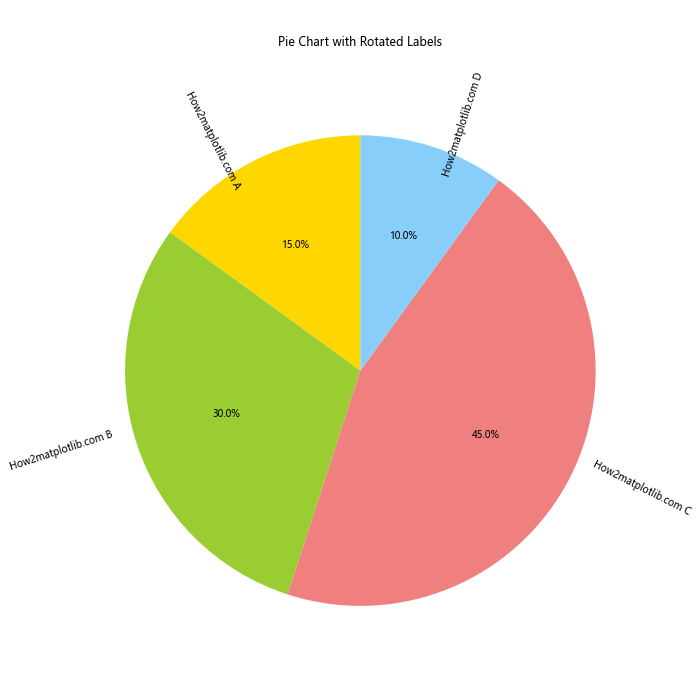
在这个饼图例子中,我们根据每个扇形的角度动态旋转标签,使其与扇形对齐。对于位于饼图左半部分的标签,我们还进行了额外的旋转和对齐调整,以确保所有标签都是可读的。
6.3 在散点图中旋转标签
在散点图中,我们可能需要为每个点添加旋转的标签,以避免重叠:
import matplotlib.pyplot as plt
import numpy as np

np.random.seed(42)
x = np.random.rand(15)
y = np.random.rand(15)
labels = [f'How2matplotlib.com Point {i}' for i in range(15)]

plt.figure(figsize=(10, 8))
plt.scatter(x, y)

for i, (xi, yi, label) in enumerate(zip(x, y, labels)):
    angle = np.random.randint(-45, 45)  # 随机角度
    plt.annotate(label, (xi, yi), rotation=angle,
                 xytext=(5, 5), textcoords='offset points',
                 ha='left', va='bottom',
                 bbox=dict(boxstyle='round,pad=0.5', fc='yellow', alpha=0.5),
                 arrowprops=dict(arrowstyle='->', connectionstyle='arc3,rad=0'))

plt.title('Scatter Plot with Rotated Labels')
plt.xlim(0, 1)
plt.ylim(0, 1)
plt.tight_layout()
plt.show()
Output:
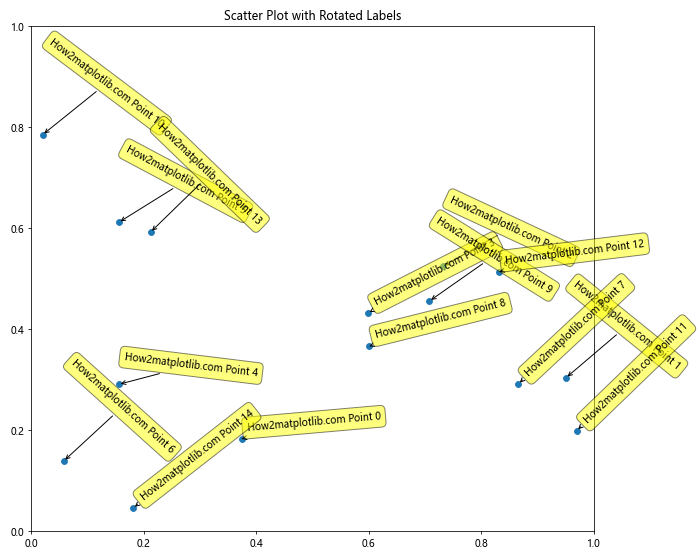
在这个散点图例子中,我们为每个点添加了一个随机旋转角度的标签。我们还使用了带有箭头的注释框,以清楚地指示每个标签对应的点。
7. 处理文本旋转中的常见问题
在使用 Matplotlib 进行文本旋转时,可能会遇到一些常见问题。让我们探讨这些问题及其解决方案。
7.1 文本重叠问题
当旋转文本时,特别是在轴标签中,可能会出现文本重叠的问题。解决这个问题的一种方法是调整图表的布局:
import matplotlib.pyplot as plt
import numpy as np

x = np.arange(10)
y = np.random.rand(10)

plt.figure(figsize=(12, 6))
plt.bar(x, y)

plt.xticks(x, [f'How2matplotlib.com Label {i}' for i in range(10)], rotation=45, ha='right')
plt.ylabel('Values')
plt.title('Avoiding Text Overlap')

# 调整底部边距
plt.subplots_adjust(bottom=0.2)

plt.tight_layout()
plt.show()
Output:
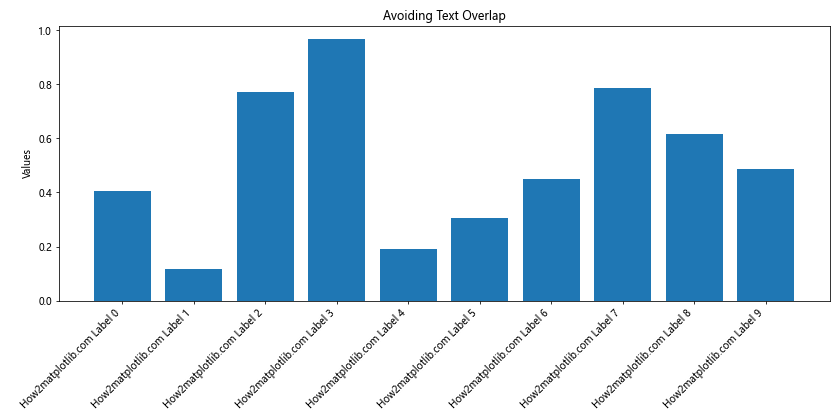
在这个例子中,我们使用 plt.subplots_adjust(bottom=0.2) 来增加图表底部的边距,为旋转的 x 轴标签腾出更多空间。
7.2 文本截断问题
有时,旋转的文本可能会被图表边界截断。我们可以通过调整图表大小或使用 tight_layout() 来解决这个问题:
import matplotlib.pyplot as plt
import numpy as np

x = np.arange(5)
y = np.random.rand(5)

fig, (ax1, ax2) = plt.subplots(1, 2, figsize=(16, 6))

# 不使用 tight_layout
ax1.bar(x, y)
ax1.set_xticklabels([f'How2matplotlib.com Very Long Label {i}' for i in range(5)], rotation=45, ha='right')
ax1.set_title('Without tight_layout()')

# 使用 tight_layout
ax2.bar(x, y)
ax2.set_xticklabels([f'How2matplotlib.com Very Long Label {i}' for i in range(5)], rotation=45, ha='right')
ax2.set_title('With tight_layout()')

plt.tight_layout()
plt.show()
Output:
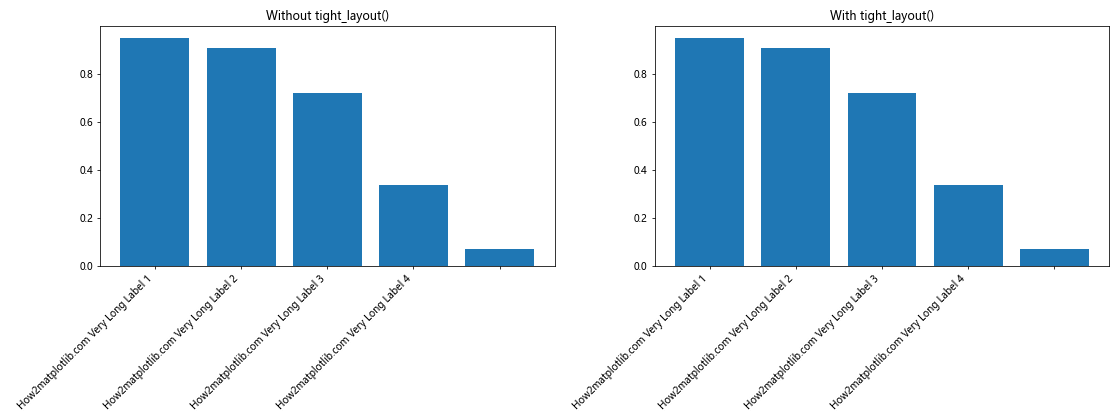
这个例子展示了使用 tight_layout() 前后的对比。使用 tight_layout() 可以自动调整子图之间的间距和边距,以避免文本被截断。
7.3 文本对齐问题
旋转文本后,可能会出现对齐问题。我们可以通过调整水平对齐(ha)和垂直对齐(va)参数来解决:
import matplotlib.pyplot as plt
import numpy as np

x = np.arange(4)
y = np.random.rand(4)

fig, (ax1, ax2) = plt.subplots(1, 2, figsize=(16, 6))

# 不良对齐
ax1.bar(x, y)
ax1.set_xticks(x)
ax1.set_xticklabels([f'How2matplotlib.com Label {i}' for i in range(4)], rotation=45)
ax1.set_title('Poor Alignment')

# 良好对齐
ax2.bar(x, y)
ax2.set_xticks(x)
ax2.set_xticklabels([f'How2matplotlib.com Label {i}' for i in range(4)], rotation=45, ha='right', va='top')
ax2.set_title('Good Alignment')

plt.tight_layout()
plt.show()
Output:
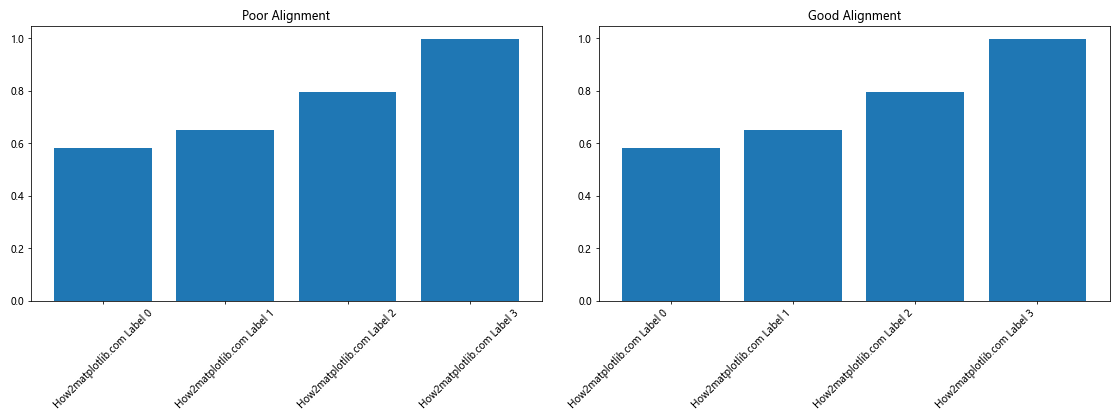
在这个例子中,我们展示了如何通过设置 ha='right' 和 va='top' 来改善旋转标签的对齐效果。
8. 高级文本旋转技巧
对于更复杂的场景,我们可以使用一些高级技巧来实现更精细的文本旋转控制。
8.1 使用 Text 对象进行精确控制
我们可以创建 Text 对象来对文本进行更精确的控制:
import matplotlib.pyplot as plt
import matplotlib.transforms as transforms

fig, ax = plt.subplots(figsize=(10, 6))

# 创建一个旋转的文本框
txt = ax.text(0.5, 0.5, 'How2matplotlib.com\nRotated Text Box',
              rotation=30, ha='center', va='center', fontsize=12,
              bbox=dict(boxstyle='round', facecolor='wheat', alpha=0.5))

# 获取文本的边界框
bbox = txt.get_window_extent(renderer=fig.canvas.get_renderer())
transf = transforms.Affine2D().rotate_deg(30).translate(bbox.width/2, 0)
bbox_rotated = bbox.transformed(transf)

# 添加一个矩形来显示旋转后的边界
rect = plt.Rectangle((bbox_rotated.x0, bbox_rotated.y0),
                     bbox_rotated.width, bbox_rotated.height,
                     fill=False, color='red')
ax.add_patch(rect)

ax.set_xlim(0, 1)
ax.set_ylim(0, 1)
ax.set_title('Advanced Text Rotation Control')
plt.tight_layout()
plt.show()
Output:
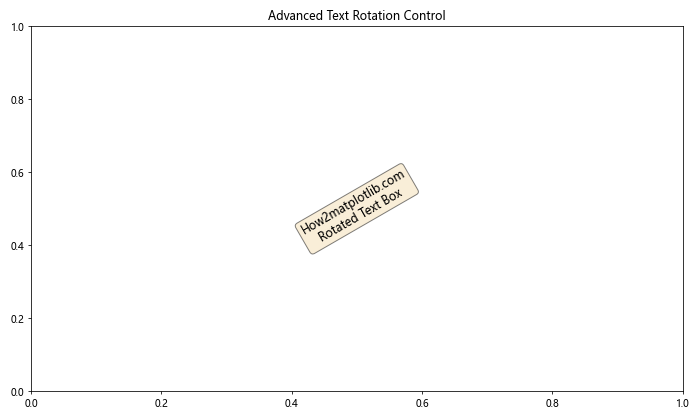
这个例子展示了如何创建一个旋转的文本框,并显示其旋转后的边界。这种技术在需要精确控制文本位置和旋转时非常有用。
8.2 动画旋转文本
我们还可以创建动画效果,使文本随时间旋转:
import matplotlib.pyplot as plt
import matplotlib.animation as animation
import numpy as np

fig, ax = plt.subplots(figsize=(8, 8))

text = ax.text(0.5, 0.5, 'How2matplotlib.com\nRotating Text',
               ha='center', va='center', fontsize=20)

ax.set_xlim(0, 1)
ax.set_ylim(0, 1)

def animate(frame):
    text.set_rotation(frame * 2)  # 每帧旋转2度
    return text,

ani = animation.FuncAnimation(fig, animate, frames=180, interval=50, blit=True)

plt.title('Animated Rotating Text')
plt.tight_layout()
plt.show()
Output:
这个例子创建了一个动画,使文本围绕其中心点旋转。这种技术可以用于创建引人注目的数据可视化效果。
9. 结合其他 Matplotlib 功能
文本旋转可以与 Matplotlib 的其他功能结合使用,以创建更复杂和信息丰富的可视化。
9.1 在 3D 图中旋转文本
在 3D 图中,文本旋转可以帮助标签更好地对齐with 3D 空间:
import matplotlib.pyplot as plt
from mpl_toolkits.mplot3d import Axes3D
import numpy as np

fig = plt.figure(figsize=(10, 8))
ax = fig.add_subplot(111, projection='3d')

# 创建一些示例数据
x = np.linspace(-5, 5, 100)
y = np.linspace(-5, 5, 100)
X, Y = np.meshgrid(x, y)
Z = np.sin(np.sqrt(X**2 + Y**2))

# 绘制曲面
surf = ax.plot_surface(X, Y, Z, cmap='viridis')

# 添加旋转的文本标签
ax.text(0, 5, 0, "How2matplotlib.com X-axis", rotation=(0, 0, 45))
ax.text(5, 0, 0, "How2matplotlib.com Y-axis", rotation=(0, -45, 0))
ax.text(0, 0, 1, "How2matplotlib.com Z-axis", rotation=(90, 0, 0))

ax.set_title('3D Plot with Rotated Text')
plt.tight_layout()
plt.show()
在这个 3D 图例子中,我们为每个轴添加了旋转的文本标签,使其更好地与 3D 空间对齐。
9.2 在极坐标图中旋转文本
在极坐标图中,文本旋转可以用来创建放射状的标签:
import matplotlib.pyplot as plt
import numpy as np

fig, ax = plt.subplots(figsize=(10, 10), subplot_kw=dict(projection='polar'))

# 创建一些数据
r = np.linspace(0, 1, 100)
theta = np.linspace(0, 2*np.pi, 100)
R, Theta = np.meshgrid(r, theta)

Z = R**2 * (1 - R**2) * np.cos(4*Theta)

# 绘制等高线图
ax.contourf(Theta, R, Z, cmap='viridis')

# 添加旋转的径向标签
for angle in range(0, 360, 45):
    ax.text(np.radians(angle), 1.1, f'How2matplotlib.com {angle}°',
            rotation=angle-90, ha='center', va='center')

ax.set_title('Polar Plot with Rotated Labels')
plt.tight_layout()
plt.show()
Output:
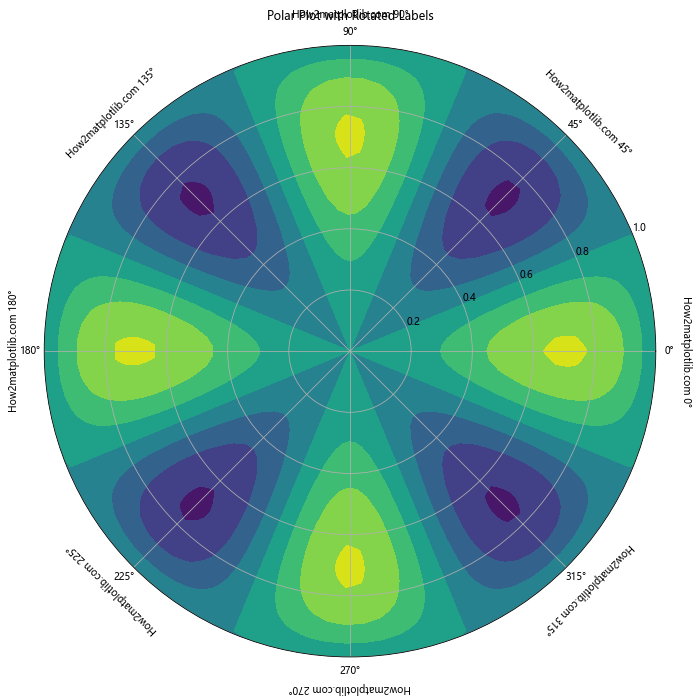
这个极坐标图例子展示了如何添加旋转的径向标签,使其与极坐标系的角度对齐。
10. 最佳实践和性能考虑
在使用 Matplotlib 进行文本旋转时,有一些最佳实践和性能考虑需要注意。
10.1 避免过度使用文本旋转
虽然文本旋转可以解决标签重叠的问题,但过度使用可能会降低图表的可读性。只在必要时使用文本旋转,并考虑其他替代方案,如缩短标签或使用换行。
import matplotlib.pyplot as plt
import numpy as np

categories = ['How2matplotlib.com Very Long Category ' + str(i) for i in range(10)]
values = np.random.rand(10)

fig, (ax1, ax2) = plt.subplots(1, 2, figsize=(16, 6))

# 过度使用旋转
ax1.bar(categories, values)
ax1.set_xticklabels(categories, rotation=90)
ax1.set_title('Overuse of Rotation')

# 更好的方法:缩短标签并使用换行
short_categories = [f'Cat {i}\n{cat.split()[-1]}' for i, cat in enumerate(categories)]
ax2.bar(short_categories, values)
ax2.set_xticklabels(short_categories, rotation=0)
ax2.set_title('Better Approach: Shortened Labels with Line Breaks')

plt.tight_layout()
plt.show()
Output:
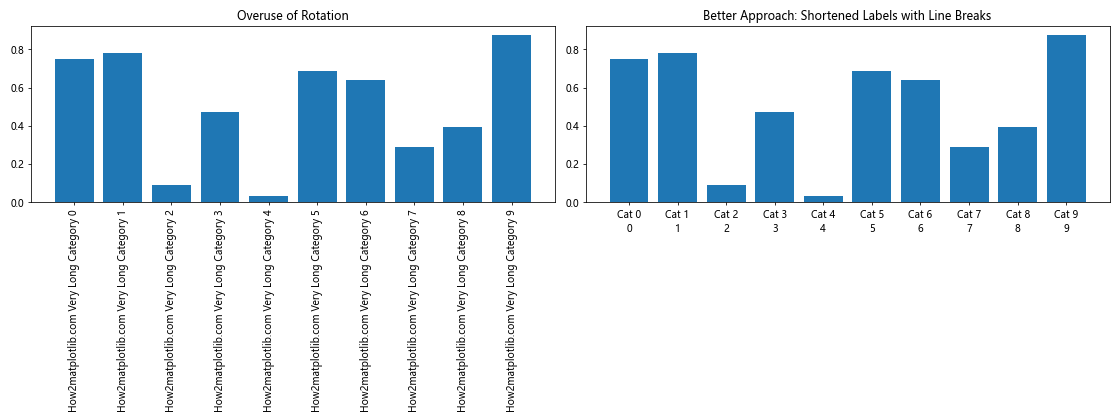
这个例子对比了过度使用旋转和使用更好的标签处理方法的效果。
10.2 使用矢量图形格式
当保存包含旋转文本的图表时,使用矢量图形格式(如 SVG 或 PDF)可以保持文本的清晰度,无论如何缩放:
import matplotlib.pyplot as plt
import numpy as np

x = np.linspace(0, 10, 100)
y = np.sin(x)

plt.figure(figsize=(10, 6))
plt.plot(x, y)
plt.title('How2matplotlib.com Sine Wave with Rotated Labels', rotation=10)
plt.xlabel('X-axis', rotation=15)
plt.ylabel('Y-axis', rotation=75)

# 保存为 SVG 格式
plt.savefig('rotated_text_example.svg', format='svg', dpi=300)
plt.close()

print("图表已保存为 SVG 格式")
这个例子展示了如何将包含旋转文本的图表保存为 SVG 格式,这将保持文本的清晰度和可编辑性。
10.3 性能优化
当处理大量旋转文本时,可能会影响渲染性能。在这种情况下,可以考虑使用 set_rasterized(True) 来栅格化文本,特别是在保存为 PDF 格式时:
import matplotlib.pyplot as plt
import numpy as np

fig, ax = plt.subplots(figsize=(10, 8))

# 生成大量数据点
n = 1000
x = np.random.rand(n)
y = np.random.rand(n)

# 绘制散点图
scatter = ax.scatter(x, y, c=np.random.rand(n), cmap='viridis')

# 为每个点添加旋转的文本标签
for i, (xi, yi) in enumerate(zip(x, y)):
    text = ax.text(xi, yi, f'How2matplotlib.com Point {i}',
                   rotation=np.random.randint(0, 360),
                   fontsize=8, alpha=0.7)
    text.set_rasterized(True)  # 栅格化文本以提高性能

ax.set_title('Performance Optimization for Many Rotated Labels')
plt.tight_layout()

# 保存为 PDF,文本将被栅格化
plt.savefig('many_rotated_labels.pdf', dpi=300)
plt.close()

print("包含大量旋转标签的图表已保存为 PDF")
这个例子展示了如何在处理大量旋转文本时使用栅格化来优化性能,特别是在保存为 PDF 格式时。
结论
Matplotlib 中的文本旋转是一个强大的工具,可以显著提升数据可视化的清晰度和美观性。通过本文介绍的各种技术和示例,你应该能够熟练地在各种图表中应用文本旋转,解决常见问题,并创建出既信息丰富又视觉吸引的图表。
记住,文本旋转应该谨慎使用,始终以提高可读性和信息传达为目标。结合其他 Matplotlib 功能,如颜色编码、图例和注释,你可以创建出专业水准的数据可视化作品。
随着实践的积累,你将能够更加自如地处理各种复杂的文本旋转场景,为你的数据分析和展示工作增添新的维度。继续探索和实验 Matplotlib 的各种功能,你会发现更多创新的方式来呈现你的数据故事。
 极客教程
极客教程