Matplotlib 文本颜色设置:全面指南与实用技巧
Matplotlib 是 Python 中最流行的数据可视化库之一,它提供了丰富的功能来创建各种类型的图表和绘图。在数据可视化中,文本元素的颜色设置是一个重要的方面,它可以帮助我们突出重要信息、增强可读性,并使图表更具吸引力。本文将深入探讨 Matplotlib 中文本颜色的设置方法,包括基本用法、高级技巧以及常见问题的解决方案。
1. 基本文本颜色设置
在 Matplotlib 中,我们可以使用多种方法来设置文本的颜色。最常见的方法是通过 color 参数来指定颜色。
1.1 使用颜色名称
Matplotlib 支持多种预定义的颜色名称,如 ‘red’、’blue’、’green’ 等。
import matplotlib.pyplot as plt

fig, ax = plt.subplots()
ax.text(0.5, 0.5, 'How2matplotlib.com - Red Text', color='red', ha='center', va='center')
plt.show()
Output:
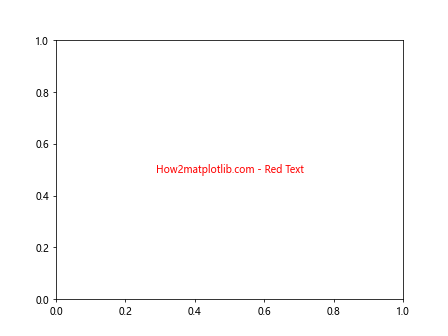
在这个例子中,我们使用 ax.text() 方法在图表中添加文本,并通过 color='red' 将文本颜色设置为红色。ha='center' 和 va='center' 用于将文本水平和垂直居中。
1.2 使用 RGB 值
除了颜色名称,我们还可以使用 RGB 值来精确指定颜色。RGB 值以元组形式表示,每个分量的范围是 0 到 1。
import matplotlib.pyplot as plt

fig, ax = plt.subplots()
ax.text(0.5, 0.5, 'How2matplotlib.com - Custom RGB Color', color=(0.2, 0.4, 0.6), ha='center', va='center')
plt.show()
Output:
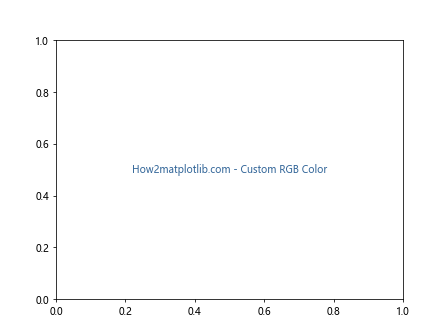
这个例子中,我们使用 color=(0.2, 0.4, 0.6) 来设置一个自定义的蓝色调。
1.3 使用十六进制颜色代码
十六进制颜色代码是另一种常用的颜色表示方法。它以 ‘#’ 开头,后跟 6 个十六进制数字。
import matplotlib.pyplot as plt

fig, ax = plt.subplots()
ax.text(0.5, 0.5, 'How2matplotlib.com - Hex Color Code', color='#FF5733', ha='center', va='center')
plt.show()
Output:
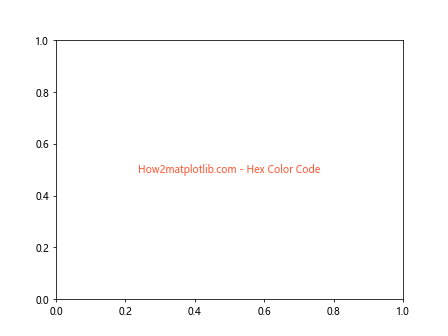
在这个例子中,我们使用 color='#FF5733' 来设置一个橙红色的文本。
2. 高级文本颜色设置
除了基本的颜色设置,Matplotlib 还提供了一些高级功能来处理文本颜色。
2.1 使用 RGBA 值
RGBA 值允许我们在 RGB 的基础上添加透明度。透明度的范围是 0(完全透明)到 1(完全不透明)。
import matplotlib.pyplot as plt

fig, ax = plt.subplots()
ax.text(0.5, 0.5, 'How2matplotlib.com - RGBA Color', color=(1, 0, 0, 0.5), ha='center', va='center')
plt.show()
Output:
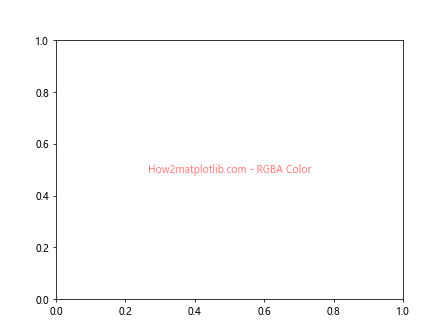
这个例子中,我们使用 color=(1, 0, 0, 0.5) 来创建一个半透明的红色文本。
2.2 使用颜色映射
颜色映射(colormap)是一种将数值范围映射到颜色范围的方法。我们可以使用颜色映射来为文本设置颜色。
import matplotlib.pyplot as plt
import numpy as np

fig, ax = plt.subplots()
cmap = plt.get_cmap('viridis')
for i in range(10):
    color = cmap(i / 10)
    ax.text(0.1, i / 10, f'How2matplotlib.com - Color {i}', color=color)
plt.show()
Output:
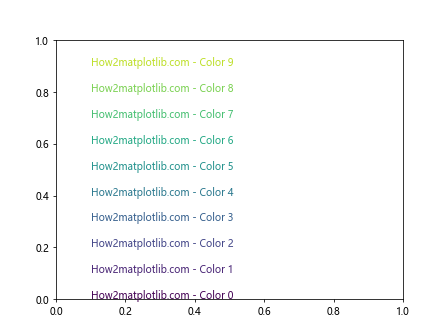
在这个例子中,我们使用 ‘viridis’ 颜色映射来为 10 个文本设置不同的颜色。
2.3 使用循环颜色
Matplotlib 提供了一个内置的颜色循环,我们可以利用它来为多个文本元素设置不同的颜色。
import matplotlib.pyplot as plt

fig, ax = plt.subplots()
colors = plt.rcParams['axes.prop_cycle'].by_key()['color']
for i, color in enumerate(colors):
    ax.text(0.1, i / 10, f'How2matplotlib.com - Color {i}', color=color)
plt.show()
Output:
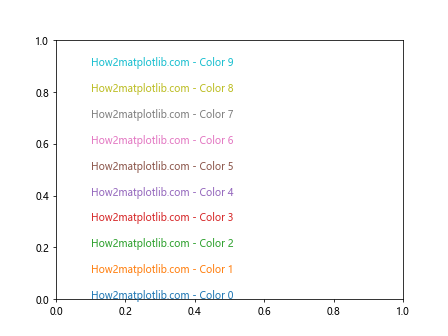
这个例子展示了如何使用 Matplotlib 的默认颜色循环来为多个文本设置不同的颜色。
3. 文本颜色与背景
有时,我们需要考虑文本颜色与背景的关系,以确保文本的可读性。
3.1 设置文本背景色
我们可以为文本设置背景色,以增强其与图表背景的对比度。
import matplotlib.pyplot as plt

fig, ax = plt.subplots()
ax.set_facecolor('lightgray')
ax.text(0.5, 0.5, 'How2matplotlib.com - Text with Background', color='white',
        bbox=dict(facecolor='blue', edgecolor='none', alpha=0.7),
        ha='center', va='center')
plt.show()
Output:
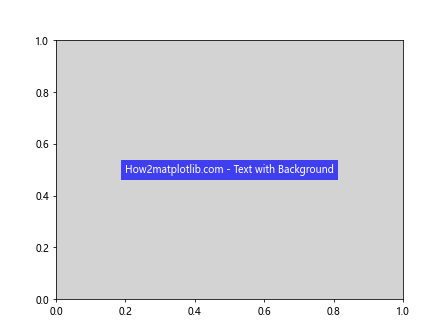
在这个例子中,我们使用 bbox 参数为文本添加了一个蓝色的背景框,并将文本颜色设置为白色,以确保在深色背景上的可读性。
3.2 自动调整文本颜色
我们可以根据背景的亮度自动调整文本的颜色,以确保良好的对比度。
import matplotlib.pyplot as plt
import numpy as np

def get_text_color(bg_color):
    rgb = np.array(plt.colors.to_rgb(bg_color))
    luminance = 0.299 * rgb[0] + 0.587 * rgb[1] + 0.114 * rgb[2]
    return 'white' if luminance < 0.5 else 'black'

fig, ax = plt.subplots()
bg_colors = ['lightgray', 'darkgray', 'lightblue', 'navy']
for i, bg_color in enumerate(bg_colors):
    text_color = get_text_color(bg_color)
    ax.text(0.25 * (i + 1), 0.5, f'How2matplotlib.com\nAuto Color',
            color=text_color, bbox=dict(facecolor=bg_color, edgecolor='none'),
            ha='center', va='center')
plt.show()
这个例子展示了如何根据背景色的亮度自动选择文本颜色,以确保在不同背景下的可读性。
4. 文本颜色动画
我们可以创建文本颜色的动画效果,使图表更具动态性和吸引力。
4.1 简单的颜色变化动画
以下是一个简单的文本颜色变化动画示例:
import matplotlib.pyplot as plt
import matplotlib.animation as animation
import numpy as np

fig, ax = plt.subplots()
text = ax.text(0.5, 0.5, 'How2matplotlib.com\nColor Animation', ha='center', va='center', fontsize=20)

def update(frame):
    r = (np.sin(frame * 0.1) + 1) / 2
    g = (np.sin(frame * 0.1 + 2*np.pi/3) + 1) / 2
    b = (np.sin(frame * 0.1 + 4*np.pi/3) + 1) / 2
    text.set_color((r, g, b))
    return text,

ani = animation.FuncAnimation(fig, update, frames=100, interval=50, blit=True)
plt.show()
Output:
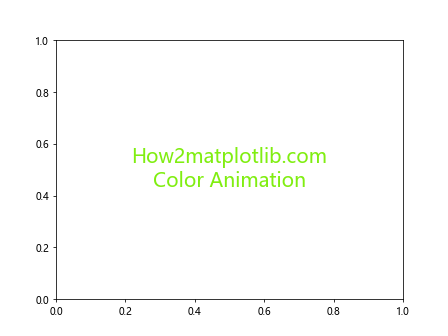
这个例子创建了一个文本,其颜色随时间变化,产生一个彩虹效果。
4.2 颜色渐变动画
我们还可以创建颜色渐变的动画效果:
import matplotlib.pyplot as plt
import matplotlib.animation as animation
import numpy as np

fig, ax = plt.subplots()
text = ax.text(0.5, 0.5, 'How2matplotlib.com\nGradient Animation', ha='center', va='center', fontsize=20)

def update(frame):
    gradient = np.linspace(0, 1, 100)
    colors = plt.cm.viridis(gradient)
    color = colors[frame % 100]
    text.set_color(color)
    return text,

ani = animation.FuncAnimation(fig, update, frames=200, interval=50, blit=True)
plt.show()
Output:
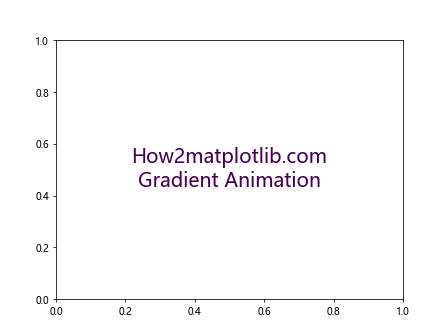
这个例子展示了如何使用颜色映射创建一个平滑的颜色渐变动画。
5. 文本颜色与数据可视化
在数据可视化中,文本颜色可以用来传递额外的信息或强调特定的数据点。
5.1 根据数值设置文本颜色
我们可以根据数据值来设置文本的颜色,以直观地表示数值的大小。
import matplotlib.pyplot as plt
import numpy as np

fig, ax = plt.subplots()
data = np.random.rand(10)
cmap = plt.get_cmap('RdYlGn')

for i, value in enumerate(data):
    color = cmap(value)
    ax.text(0.1, i / 10, f'How2matplotlib.com - Value: {value:.2f}', color=color)

plt.show()
Output:
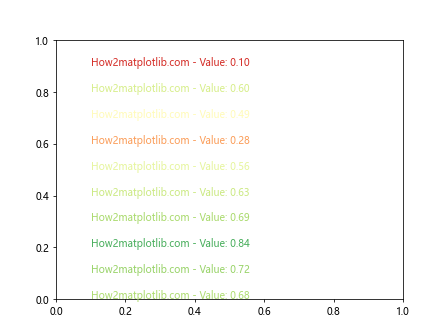
这个例子展示了如何根据随机生成的数值来设置文本颜色,使用了从红到绿的颜色映射。
5.2 在散点图中使用文本颜色
在散点图中,我们可以使用文本颜色来标注特定的数据点。
import matplotlib.pyplot as plt
import numpy as np

fig, ax = plt.subplots()
x = np.random.rand(20)
y = np.random.rand(20)
colors = np.random.rand(20)

scatter = ax.scatter(x, y, c=colors, cmap='viridis')

for i, (xi, yi, color) in enumerate(zip(x, y, colors)):
    ax.text(xi, yi, f'Point {i}', color=plt.cm.viridis(color),
            ha='center', va='bottom')

plt.colorbar(scatter)
plt.title('How2matplotlib.com - Scatter Plot with Colored Labels')
plt.show()
Output:
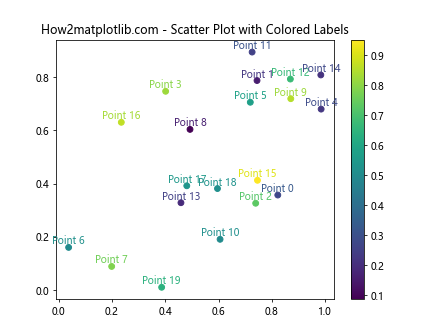
这个例子创建了一个散点图,其中每个点都有一个颜色标签,颜色与点的颜色相对应。
6. 文本颜色与图例
在创建图例时,我们也需要考虑文本颜色的设置。
6.1 自定义图例文本颜色
我们可以自定义图例中文本的颜色,以增强其可读性或美观性。
import matplotlib.pyplot as plt

fig, ax = plt.subplots()
ax.plot([0, 1], [0, 1], label='Line 1')
ax.plot([0, 1], [1, 0], label='Line 2')

legend = ax.legend()
for text in legend.get_texts():
    text.set_color('navy')

plt.title('How2matplotlib.com - Custom Legend Text Color')
plt.show()
Output:
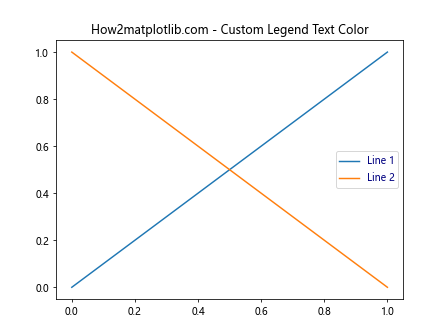
这个例子展示了如何将图例中的所有文本颜色设置为深蓝色。
6.2 图例文本颜色与线条颜色匹配
为了保持一致性,我们可以让图例中的文本颜色与对应的线条颜色相匹配。
import matplotlib.pyplot as plt

fig, ax = plt.subplots()
line1, = ax.plot([0, 1], [0, 1], label='Line 1', color='red')
line2, = ax.plot([0, 1], [1, 0], label='Line 2', color='blue')

legend = ax.legend()
legend.get_texts()[0].set_color(line1.get_color())
legend.get_texts()[1].set_color(line2.get_color())

plt.title('How2matplotlib.com - Matching Legend Text and Line Colors')
plt.show()
Output:
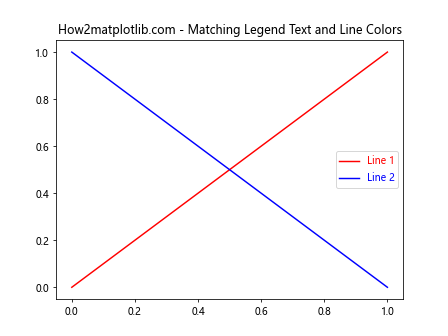
这个例子展示了如何使图例中的文本颜色与对应的线条颜色相匹配。
7. 文本颜色与主题
Matplotlib 提供了多种内置主题,我们可以根据不同的主题来调整文本颜色。
7.1 使用深色主题
当使用深色主题时,我们需要相应地调整文本颜色以确保可读性。
import matplotlib.pyplot as plt

plt.style.use('dark_background')

fig, ax = plt.subplots()
ax.text(0.5, 0.5, 'How2matplotlib.com\nDark Theme', color='white',
        ha='center', va='center', fontsize=20)

plt.title('Text Color in Dark Theme')
plt.show()
Output:
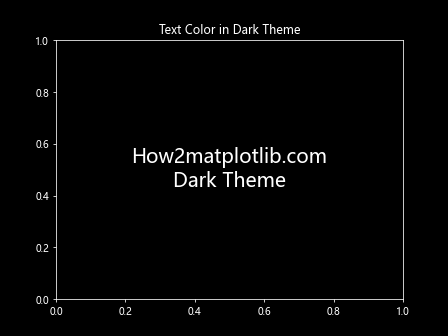
这个例子展示了如何在深色主题下使用白色文本以确保可读性。
7.2 创建自定义主题
我们还可以创建自定义主题,并在其中定义文本颜色。
import matplotlib.pyplot as plt

custom_style = {
    'text.color': '#FF5733',
    'axes.labelcolor': '#33FF57',
    'xtick.color': '#5733FF',
    'ytick.color': '#5733FF',
}

plt.rcParams.update(custom_style)

fig, ax = plt.subplots()
ax.text(0.5, 0.5, 'How2matplotlib.com\nCustom Theme', ha='center', va='center', fontsize=20)

ax.set_xlabel('X Label')
ax.set_ylabel('Y Label')
plt.title('Custom Theme with Different Text Colors')
plt.show()
Output:
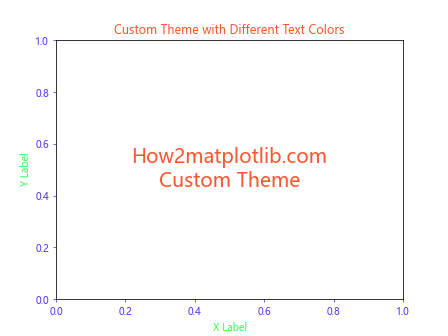
这个例子展示了如何创建一个自定义主题,其中为不同类型的文本(如主文本、轴标签、刻度标签)设置了不同的颜色。
8. 文本颜色与可访问性
在设计数据可视化时,考虑可访问性是非常重要的。我们需要确保文本颜色对于所有用户都是可读的,包括那些可能有色盲或其他视觉障碍的用户。
8.1 使用色盲友好的颜色方案
我们可以使用专门设计的色盲友好的颜色方案来确保文本对所有用户都清晰可见。
import matplotlib.pyplot as plt
import seaborn as sns

# 使用 seaborn 的色盲友好调色板
colors = sns.color_palette("colorblind")

fig, ax = plt.subplots()
for i, color in enumerate(colors):
    ax.text(0.1, i / 10, f'How2matplotlib.com - Color {i}', color=color)

plt.title('Colorblind-friendly Text Colors')
plt.show()
Output:
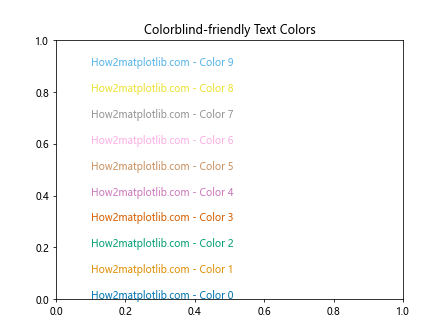
这个例子使用了 Seaborn 库提供的色盲友好调色板来设置文本颜色。
8.2 检查颜色对比度
为了确保文本的可读性,我们可以计算文本颜色与背景色之间的对比度。
import matplotlib.pyplot as plt
import numpy as np

def contrast_ratio(color1, color2):
    luminance1 = 0.299 * color1[0] + 0.587 * color1[1] + 0.114 * color1[2]
    luminance2 = 0.299 * color2[0] + 0.587 * color2[1] + 0.114 * color2[2]
    ratio = (max(luminance1, luminance2) + 0.05) / (min(luminance1, luminance2) + 0.05)
    return ratio

fig, ax = plt.subplots()
background_color = (0.9, 0.9, 0.9)  # 浅灰色背景
ax.set_facecolor(background_color)

text_colors = [(0, 0, 0), (0.5, 0.5, 0.5), (1, 1, 1)]
for i, color in enumerate(text_colors):
    ratio = contrast_ratio(color, background_color)
    ax.text(0.1, i / 3, f'How2matplotlib.com - Contrast Ratio: {ratio:.2f}', color=color)

plt.title('Text Color Contrast Check')
plt.show()
Output:
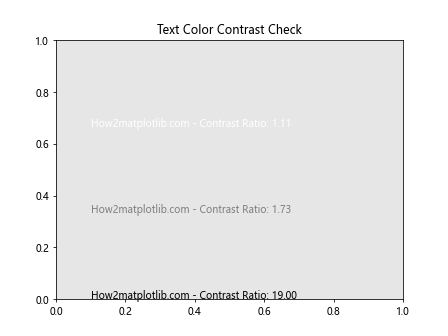
这个例子计算并显示了不同文本颜色与背景色之间的对比度比率。通常,对比度比率应该至少为 4.5:1 以确保良好的可读性。
9. 文本颜色与 3D 图表
在 3D 图表中,文本颜色的设置可能需要特别注意,以确保在不同角度和深度下的可见性。
9.1 3D 散点图中的文本标签
在 3D 散点图中,我们可以为每个点添加带有自定义颜色的文本标签。
import matplotlib.pyplot as plt
import numpy as np

fig = plt.figure()
ax = fig.add_subplot(111, projection='3d')

# 生成一些随机数据
n = 20
xs = np.random.rand(n)
ys = np.random.rand(n)
zs = np.random.rand(n)

# 绘制散点图
scatter = ax.scatter(xs, ys, zs, c=zs, cmap='viridis')

# 添加文本标签
for x, y, z in zip(xs, ys, zs):
    label = f'({x:.2f}, {y:.2f}, {z:.2f})'
    ax.text(x, y, z, label, color=plt.cm.viridis(z))

ax.set_xlabel('X Label')
ax.set_ylabel('Y Label')
ax.set_zlabel('Z Label')
plt.title('How2matplotlib.com - 3D Scatter Plot with Colored Labels')
plt.colorbar(scatter)
plt.show()
Output:
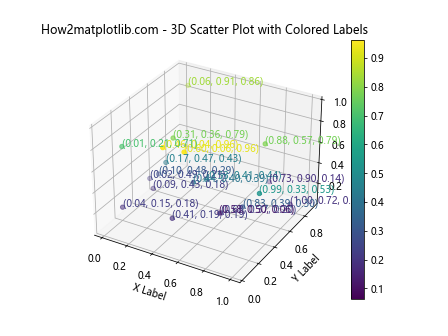
这个例子创建了一个 3D 散点图,每个点都有一个带颜色的文本标签,颜色与点的 z 坐标相对应。
9.2 3D 表面图中的文本注释
在 3D 表面图中,我们可以添加文本注释来标注特定的区域或特征。
import matplotlib.pyplot as plt
import numpy as np
from mpl_toolkits.mplot3d import Axes3D

fig = plt.figure()
ax = fig.add_subplot(111, projection='3d')

# 创建一个简单的 3D 表面
X = np.arange(-5, 5, 0.25)
Y = np.arange(-5, 5, 0.25)
X, Y = np.meshgrid(X, Y)
R = np.sqrt(X**2 + Y**2)
Z = np.sin(R)

# 绘制表面
surf = ax.plot_surface(X, Y, Z, cmap='viridis')

# 添加文本注释
ax.text(0, 0, 1, 'How2matplotlib.com\nPeak', color='red', fontsize=12)
ax.text(4, 4, -0.5, 'How2matplotlib.com\nValley', color='blue', fontsize=12)

ax.set_xlabel('X Label')
ax.set_ylabel('Y Label')
ax.set_zlabel('Z Label')
plt.title('3D Surface Plot with Text Annotations')
plt.colorbar(surf)
plt.show()
Output:
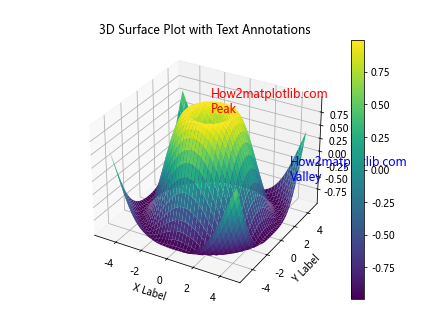
这个例子创建了一个 3D 表面图,并在图中添加了两个带有不同颜色的文本注释来标注峰值和谷值。
10. 高级文本颜色技巧
最后,让我们探讨一些高级的文本颜色技巧,这些技巧可以帮助你创建更加复杂和吸引人的可视化效果。
10.1 文本颜色渐变
我们可以创建一个文本,其颜色沿着文本的长度呈现渐变效果。
import matplotlib.pyplot as plt
import matplotlib.patheffects as path_effects

fig, ax = plt.subplots(figsize=(10, 4))

text = ax.text(0.5, 0.5, 'How2matplotlib.com', fontsize=40, ha='center', va='center')

# 创建颜色渐变
gradient = plt.cm.viridis(np.linspace(0, 1, 256))
gradient_image = plt.cm.ScalarMappable(cmap=plt.cm.viridis)

# 应用渐变效果
text.set_path_effects([path_effects.PathPatchEffect(offset=(0, 0), hatch='/', facecolor=gradient_image.to_rgba(0)),
                       path_effects.PathPatchEffect(edgecolor='black', linewidth=1, facecolor='none')])

plt.title('Text with Color Gradient')
plt.axis('off')
plt.show()
这个例子创建了一个文本,其颜色从左到右呈现渐变效果,使用了 ‘viridis’ 颜色映射。
10.2 文本阴影效果
添加阴影可以增强文本的可读性,特别是在复杂的背景上。
import matplotlib.pyplot as plt
import matplotlib.patheffects as path_effects

fig, ax = plt.subplots(figsize=(10, 4))

# 创建一个复杂的背景
x = np.linspace(0, 10, 100)
y = np.sin(x) + np.random.normal(0, 0.1, 100)
ax.plot(x, y, 'k-', alpha=0.3)
ax.fill_between(x, y, alpha=0.1)

# 添加带阴影的文本
text = ax.text(0.5, 0.5, 'How2matplotlib.com', fontsize=40, ha='center', va='center', color='white')
text.set_path_effects([path_effects.withStroke(linewidth=3, foreground='black')])

plt.title('Text with Shadow Effect')
plt.axis('off')
plt.show()
这个例子在一个复杂的背景上添加了一个带有黑色阴影的白色文本,增强了文本的可读性。
10.3 动态文本颜色
我们可以创建一个动态变化的文本颜色效果,使文本看起来像是在闪烁或脉动。
import matplotlib.pyplot as plt
import matplotlib.animation as animation
import numpy as np

fig, ax = plt.subplots()
text = ax.text(0.5, 0.5, 'How2matplotlib.com', ha='center', va='center', fontsize=40)

def update(frame):
    # 使用正弦函数创建颜色变化
    r = (np.sin(frame * 0.1) + 1) / 2
    g = (np.sin(frame * 0.1 + 2*np.pi/3) + 1) / 2
    b = (np.sin(frame * 0.1 + 4*np.pi/3) + 1) / 2
    text.set_color((r, g, b))
    return text,

ani = animation.FuncAnimation(fig, update, frames=200, interval=50, blit=True)
plt.title('Dynamic Text Color')
plt.axis('off')
plt.show()
Output:
这个例子创建了一个文本,其颜色随时间动态变化,产生一种脉动或闪烁的效果。
结论
通过本文,我们深入探讨了 Matplotlib 中文本颜色设置的各种方法和技巧。从基本的颜色设置到高级的动画效果,我们涵盖了广泛的主题,包括颜色与背景的关系、数据可视化中的颜色应用、可访问性考虑以及 3D 图表中的文本颜色设置等。
掌握这些技巧将使你能够创建更加丰富、吸引人和信息丰富的数据可视化。记住,颜色不仅仅是装饰,它是传递信息的重要工具。合理使用文本颜色可以突出重要信息、增强可读性,并使你的图表更具吸引力和专业性。
在实际应用中,请始终考虑你的目标受众和展示环境,确保你的颜色选择既美观又实用。通过不断实践和实验,你将能够熟练运用这些技巧,创造出令人印象深刻的数据可视化作品。
 极客教程
极客教程