Matplotlib Axes类
Axes对象是带有数据空间的图像区域。一个图形可以包含多个Axes对象,但一个Axes对象只能属于一个图形。Axes对象包含两个(或三个在3D情况下)Axis对象。Axes类及其成员函数是使用OO接口进行操作的主要入口点。
通过调用add_axes()方法,可以将Axes对象添加到图形中。它返回axes对象,并在位置rect [left, bottom, width, height]上添加一个axes,其中所有量都是相对于图形宽度和高度的比例。
参数
以下是Axes类的参数:
- rect – 一个长度为4的序列 [left, bottom, width, height]。
ax=fig.add_axes([0,0,1,1])
axes类的以下成员函数可向图中添加不同的元素-
图例
axes类的 legend() 方法向图形中添加图例。它接受三个参数-
ax.legend(handles, labels, loc)
其中 labels 是一个字符串序列,handles 是一个Line2D或Patch实例的序列。loc 可以是一个字符串或一个整数,用于指定图例的位置。
| Location string | Location code |
|---|---|
| Best | 0 |
| upper right | 1 |
| upper left | 2 |
| lower left | 3 |
| lower right | 4 |
| Right | 5 |
| Center left | 6 |
| Center right | 7 |
| lower center | 8 |
| upper center | 9 |
| Center | 10 |
axes.plot()
这是axes类的基本方法,它将一个数组的值与另一个数组作为线条或标记进行绘制。plot()方法可以有一个可选的格式字符串参数,用于指定线条和标记的颜色、样式和大小。
颜色代码
| Character | Color |
|---|---|
| ‘b’ | Blue |
| ‘g’ | Green |
| ‘r’ | Red |
| ‘b’ | Blue |
| ‘c’ | Cyan |
| ‘m’ | Magenta |
| ‘y’ | Yellow |
| ‘k’ | Black |
| ‘b’ | Blue |
| ‘w’ | White |
标记代码
| Character | Description |
|---|---|
| ‘.’ | Point marker |
| ‘o’ | Circle marker |
| ‘x’ | X marker |
| ‘D’ | Diamond marker |
| ‘H’ | Hexagon marker |
| ‘s’ | Square marker |
| ‘+’ | Plus marker |
线条样式
| Character | Description |
|---|---|
| ‘-‘ | Solid line |
| ‘—‘ | Dashed line |
| ‘-.’ | Dash-dot line |
| ‘:’ | Dotted line |
| ‘H’ | Hexagon marker |
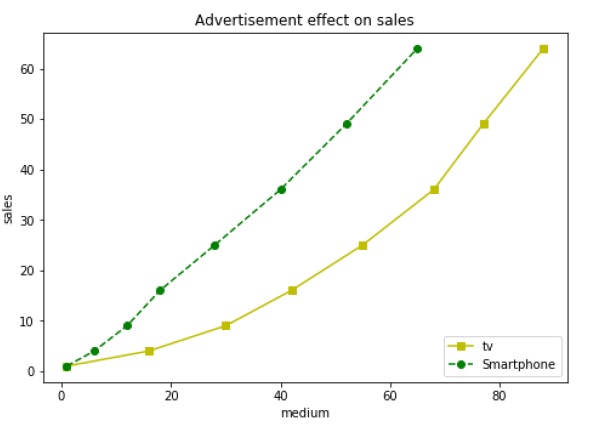
以下示例以线图的形式显示了电视和智能手机的广告费用和销售数字。代表电视的线条是黄色的实线,带有方形标记,而代表智能手机的线条是绿色的虚线,带有圆形标记。
import matplotlib.pyplot as plt
y = [1, 4, 9, 16, 25,36,49, 64]
x1 = [1, 16, 30, 42,55, 68, 77,88]
x2 = [1,6,12,18,28, 40, 52, 65]
fig = plt.figure()
ax = fig.add_axes([0,0,1,1])
l1 = ax.plot(x1,y,'ys-') # solid line with yellow colour and square marker
l2 = ax.plot(x2,y,'go--') # dash line with green colour and circle marker
ax.legend(labels = ('tv', 'Smartphone'), loc = 'lower right') # legend placed at lower right
ax.set_title("Advertisement effect on sales")
ax.set_xlabel('medium')
ax.set_ylabel('sales')
plt.show()
当执行上面的代码行时,它会生成以下的图表−

 极客教程
极客教程