Matplotlib饼图标签重叠问题的解决方案
参考:matplotlib pie chart labels overlap
Matplotlib是Python中最流行的数据可视化库之一,它提供了丰富的绘图功能,其中饼图(pie chart)是一种常用的图表类型,用于展示数据的比例关系。然而,在使用Matplotlib绘制饼图时,经常会遇到标签重叠的问题,特别是当数据项较多或者某些数据占比较小时。本文将详细介绍如何解决Matplotlib饼图中标签重叠的问题,并提供多种实用的解决方案和示例代码。
1. 饼图标签重叠问题的产生原因
在绘制饼图时,Matplotlib默认会将标签放置在每个扇形的中心位置。当数据项较多或者某些数据占比较小时,标签之间的间距会变得很小,甚至会发生重叠。这不仅影响了图表的美观性,也降低了数据的可读性。
以下是一个展示标签重叠问题的简单示例:
import matplotlib.pyplot as plt

# 准备数据
sizes = [15, 30, 45, 10]
labels = ['how2matplotlib.com A', 'how2matplotlib.com B', 'how2matplotlib.com C', 'how2matplotlib.com D']

# 绘制饼图
plt.pie(sizes, labels=labels, autopct='%1.1f%%')
plt.title('Pie Chart with Overlapping Labels')
plt.axis('equal')
plt.show()
Output:
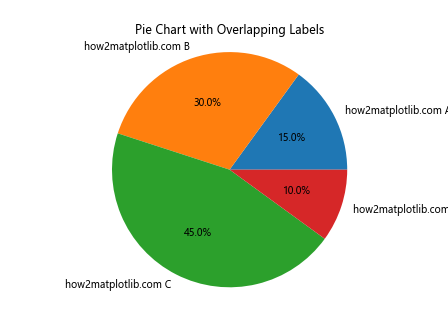
在这个例子中,我们可以看到标签之间存在重叠,特别是占比较小的扇形区域。
2. 调整图表大小和布局
解决标签重叠问题的一种简单方法是调整图表的大小和布局。通过增加图表的尺寸,我们可以为标签提供更多的空间,从而减少重叠的可能性。
import matplotlib.pyplot as plt

# 准备数据
sizes = [15, 30, 45, 10]
labels = ['how2matplotlib.com A', 'how2matplotlib.com B', 'how2matplotlib.com C', 'how2matplotlib.com D']

# 设置图表大小
plt.figure(figsize=(10, 8))

# 绘制饼图
plt.pie(sizes, labels=labels, autopct='%1.1f%%')
plt.title('Pie Chart with Adjusted Figure Size')
plt.axis('equal')
plt.show()
Output:
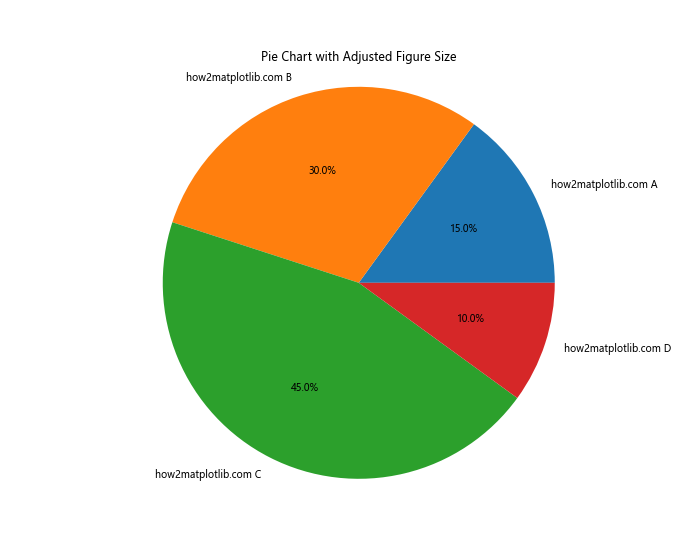
在这个例子中,我们通过plt.figure(figsize=(10, 8))设置了更大的图表尺寸,这样可以为标签提供更多的空间,减少重叠的可能性。
3. 使用wedgeprops参数调整扇形间距
另一种减少标签重叠的方法是增加扇形之间的间距。我们可以使用wedgeprops参数来实现这一点。
import matplotlib.pyplot as plt

# 准备数据
sizes = [15, 30, 45, 10]
labels = ['how2matplotlib.com A', 'how2matplotlib.com B', 'how2matplotlib.com C', 'how2matplotlib.com D']

# 绘制饼图,增加扇形间距
plt.pie(sizes, labels=labels, autopct='%1.1f%%', wedgeprops=dict(width=0.7))
plt.title('Pie Chart with Increased Wedge Spacing')
plt.axis('equal')
plt.show()
Output:
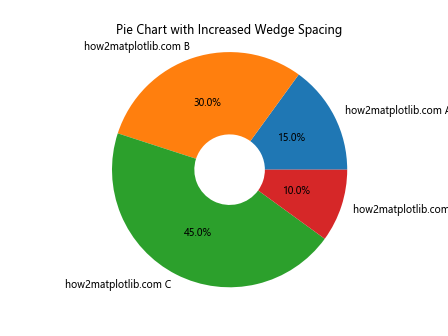
在这个例子中,我们通过设置wedgeprops=dict(width=0.7)来增加扇形之间的间距。这样可以为标签提供更多的空间,减少重叠的可能性。
4. 使用explode参数突出显示某些扇形
explode参数允许我们将某些扇形从饼图中分离出来,这不仅可以突出显示重要的数据,还能为标签创造更多空间。
import matplotlib.pyplot as plt

# 准备数据
sizes = [15, 30, 45, 10]
labels = ['how2matplotlib.com A', 'how2matplotlib.com B', 'how2matplotlib.com C', 'how2matplotlib.com D']
explode = (0, 0.1, 0, 0)  # 只突出显示第二个扇形

# 绘制饼图,使用explode参数
plt.pie(sizes, explode=explode, labels=labels, autopct='%1.1f%%')
plt.title('Pie Chart with Exploded Slice')
plt.axis('equal')
plt.show()
Output:
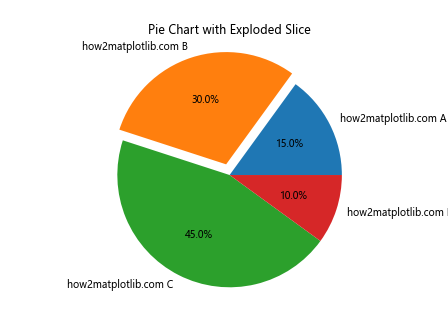
在这个例子中,我们使用explode参数将第二个扇形(’B’)从饼图中分离出来。这不仅突出显示了这个扇形,还为其标签创造了更多空间。
5. 调整标签位置
我们可以通过调整pctdistance和labeldistance参数来改变百分比标签和文本标签的位置,从而减少重叠。
import matplotlib.pyplot as plt

# 准备数据
sizes = [15, 30, 45, 10]
labels = ['how2matplotlib.com A', 'how2matplotlib.com B', 'how2matplotlib.com C', 'how2matplotlib.com D']

# 绘制饼图,调整标签位置
plt.pie(sizes, labels=labels, autopct='%1.1f%%', pctdistance=0.85, labeldistance=1.05)
plt.title('Pie Chart with Adjusted Label Positions')
plt.axis('equal')
plt.show()
Output:
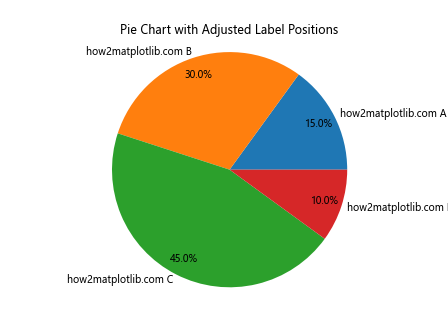
在这个例子中,我们通过设置pctdistance=0.85和labeldistance=1.05来调整百分比标签和文本标签的位置。这样可以减少标签之间的重叠。
6. 使用legend代替直接标注
当数据项较多时,直接在饼图上标注可能会导致严重的重叠。在这种情况下,我们可以使用图例(legend)来代替直接标注。
import matplotlib.pyplot as plt

# 准备数据
sizes = [15, 30, 45, 10, 5, 8, 12]
labels = ['how2matplotlib.com A', 'how2matplotlib.com B', 'how2matplotlib.com C', 'how2matplotlib.com D',
          'how2matplotlib.com E', 'how2matplotlib.com F', 'how2matplotlib.com G']

# 绘制饼图,使用图例代替直接标注
plt.pie(sizes, autopct='%1.1f%%', pctdistance=0.85)
plt.title('Pie Chart with Legend')
plt.legend(labels, title="Categories", loc="center left", bbox_to_anchor=(1, 0, 0.5, 1))
plt.axis('equal')
plt.tight_layout()
plt.show()
Output:
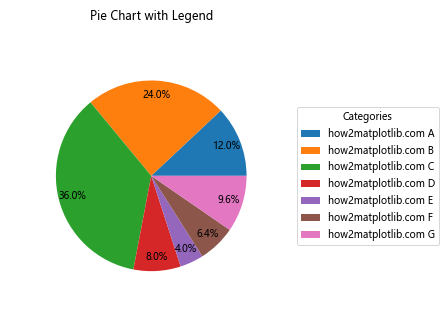
在这个例子中,我们没有直接在饼图上标注标签,而是使用plt.legend()创建了一个图例。图例被放置在饼图的右侧,这样可以避免标签重叠的问题。
7. 使用自定义函数调整标签位置
对于更复杂的情况,我们可以编写自定义函数来精确控制每个标签的位置。这种方法虽然需要更多的代码,但能够提供最大的灵活性。
import matplotlib.pyplot as plt
import numpy as np

def adjust_labels(texts, x, y):
    for t, xi, yi in zip(texts, x, y):
        t.set_position((xi * 1.1, yi * 1.1))

# 准备数据
sizes = [15, 30, 45, 10]
labels = ['how2matplotlib.com A', 'how2matplotlib.com B', 'how2matplotlib.com C', 'how2matplotlib.com D']

# 绘制饼图
fig, ax = plt.subplots()
wedges, texts, autotexts = ax.pie(sizes, labels=labels, autopct='%1.1f%%')

# 获取标签位置
bbox_props = dict(boxstyle="round,pad=0.3", fc="w", ec="k", lw=0.72)
kw = dict(arrowprops=dict(arrowstyle="-"),
          bbox=bbox_props, zorder=0, va="center")

for i, p in enumerate(wedges):
    ang = (p.theta2 - p.theta1) / 2. + p.theta1
    y = np.sin(np.deg2rad(ang))
    x = np.cos(np.deg2rad(ang))
    kw["horizontalalignment"] = {-1: "right", 1: "left"}[int(np.sign(x))]
    ax.annotate(labels[i], xy=(x, y), xytext=(1.35*np.sign(x), 1.4*y),
                **kw)

# 调整标签位置
adjust_labels(texts, np.cos(np.deg2rad([w.theta1 + (w.theta2 - w.theta1)/2 for w in wedges])),
              np.sin(np.deg2rad([w.theta1 + (w.theta2 - w.theta1)/2 for w in wedges])))

plt.title('Pie Chart with Custom Label Positioning')
plt.axis('equal')
plt.show()
Output:
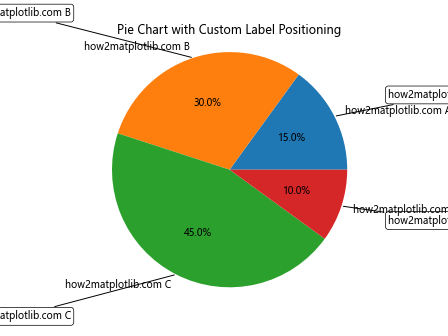
在这个例子中,我们定义了一个adjust_labels函数来调整标签的位置。我们还使用了ax.annotate()来为每个扇形添加带有连接线的标签。这种方法可以精确控制每个标签的位置,有效避免重叠。
8. 使用极坐标条形图代替饼图
当数据项非常多时,即使使用上述方法,饼图的标签仍可能出现重叠。在这种情况下,我们可以考虑使用极坐标条形图(polar bar chart)来代替饼图。极坐标条形图可以更好地处理大量数据项,同时仍然保持数据比例的直观表示。
import matplotlib.pyplot as plt
import numpy as np

# 准备数据
data = {'how2matplotlib.com A': 15, 'how2matplotlib.com B': 30, 'how2matplotlib.com C': 45,
        'how2matplotlib.com D': 10, 'how2matplotlib.com E': 5, 'how2matplotlib.com F': 8,
        'how2matplotlib.com G': 12, 'how2matplotlib.com H': 7, 'how2matplotlib.com I': 18}

# 数据处理
categories = list(data.keys())
values = list(data.values())
values = [float(value) for value in values]
values = np.array(values)
angles = np.linspace(0, 2*np.pi, len(categories), endpoint=False)

# 闭合图形
values = np.concatenate((values, [values[0]]))
angles = np.concatenate((angles, [angles[0]]))

# 绘制极坐标条形图
fig, ax = plt.subplots(figsize=(10, 10), subplot_kw=dict(projection='polar'))
ax.bar(angles[:-1], values[:-1], width=0.5, align='edge')

# 设置刻度标签
ax.set_xticks(angles[:-1])
ax.set_xticklabels(categories)

# 调整标签位置和方向
for label, angle in zip(ax.get_xticklabels(), angles):
    if angle in (0, np.pi):
        label.set_horizontalalignment('center')
    elif 0 < angle < np.pi:
        label.set_horizontalalignment('left')
    else:
        label.set_horizontalalignment('right')

plt.title('Polar Bar Chart as an Alternative to Pie Chart')
plt.show()
Output:

在这个例子中,我们使用极坐标条形图来展示数据。每个条形的长度代表数据的大小,而条形的位置则对应于饼图中扇形的位置。这种方法可以有效地处理大量数据项,同时避免标签重叠的问题。
9. 使用嵌套饼图
对于层次化的数据或者需要展示更多细节的情况,我们可以使用嵌套饼图。嵌套饼图可以在一个图表中展示多层数据,同时也可以减少标签重叠的问题。
import matplotlib.pyplot as plt

# 准备数据
sizes_outer = [30, 70]
labels_outer = ['how2matplotlib.com Group A', 'how2matplotlib.com Group B']
sizes_inner = [15, 15, 30, 40]
labels_inner = ['how2matplotlib.com A1', 'how2matplotlib.com A2', 'how2matplotlib.com B1', 'how2matplotlib.com B2']

# 创建图表
fig, ax = plt.subplots(figsize=(10, 8))

# 绘制外层饼图
outer_colors = ['#ff9999', '#66b3ff']
outer_wedges, outer_texts, outer_autotexts = ax.pie(sizes_outer, labels=labels_outer, colors=outer_colors,
                                                    autopct='%1.1f%%', startangle=90, pctdistance=0.85,
                                                    wedgeprops=dict(width=0.3, edgecolor='white'))

# 绘制内层饼图
inner_colors = ['#ff9999', '#ffcc99', '#66b3ff', '#99ff99']
inner_wedges, inner_texts, inner_autotexts = ax.pie(sizes_inner, labels=labels_inner, colors=inner_colors,
                                                    autopct='%1.1f%%', startangle=90, pctdistance=0.75,
                                                    wedgeprops=dict(width=0.6, edgecolor='white'))

# 添加标题
ax.set_title("Nested Pie Chart")

plt.show()
Output:
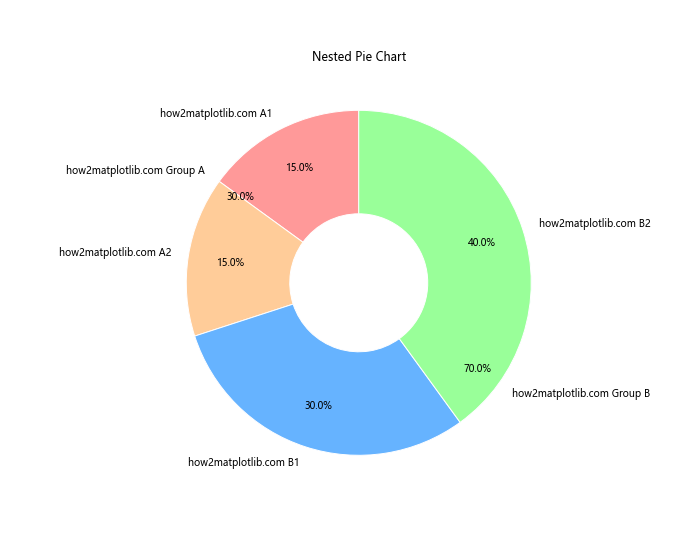
在这个例子中,我们创建了一个嵌套饼图,外层饼图展示了两个主要组别,内层饼图则展示了每个组别的细分情况。这种方法不仅可以展示更多的信息,还可以通过分层展示来减少标签重叠的问题。
10. 使用文本框和箭头标注
对于一些特殊情况,我们可以使用文本框和箭头来标注饼图,这样可以更灵活地控制标签的位置,避免重叠。
import matplotlib.pyplot as plt
import numpy as np

# 准备数据
sizes = [15, 30, 45, 10]
labels = ['how2matplotlib.com A', 'how2matplotlib.com B', 'how2matplotlib.com C', 'how2matplotlib.com D']

# 创建饼图
fig, ax = plt.subplots(figsize=(10, 8))
wedges, texts = ax.pie(sizes, wedgeprops=dict(width=0.5))

# 创建标注
bbox_props = dict(boxstyle="round,pad=0.3", fc="w", ec="k", lw=0.72)
kw = dict(xycoords='data', textcoords='data', arrowprops=dict(arrowstyle="->"),
          bbox=bbox_props, zorder=0, va="center")

for i, p in enumerate(wedges):
    ang = (p.theta2 - p.theta1) / 2. + p.theta1
    y = np.sin(np.deg2rad(ang))
    x = np.cos(np.deg2rad(ang))
    horizontalalignment = {-1: "right", 1: "left"}[int(np.sign(x))]
    connectionstyle = f"angle,angleA=0,angleB={ang}"
    kw["arrowprops"].update({"connectionstyle": connectionstyle})
    ax.annotate(f"{labels[i]}\n{sizes[i]}%", xy=(x, y), xytext=(1.35*np.sign(x), 1.4*y),
                horizontalalignment=horizontalalignment, **kw)

plt.title("Pie Chart with Text Boxes and Arrows")
plt.show()
Output:
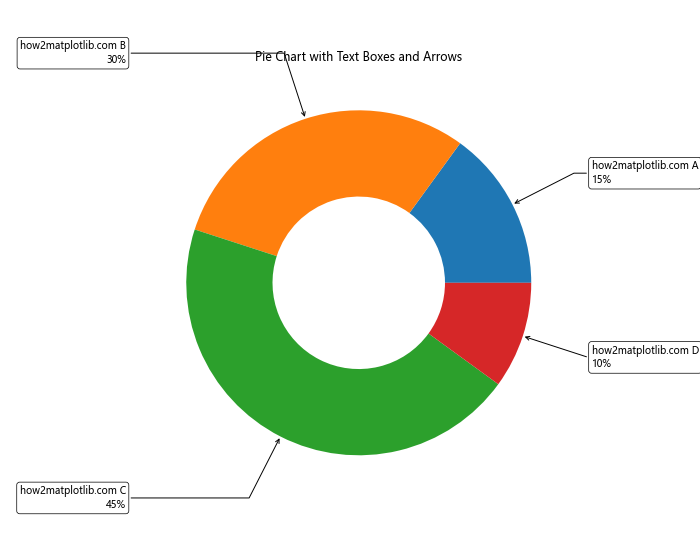
这个例子中,我们使用ax.annotate()函数为每个扇形创建了带有文本框和箭头的标注。这种方法可以让我们更自由地放置标签,有效避免重叠问题。
11. 使用自动标签位置调整算法
对于复杂的情况,我们可以实现一个自动调整标签位置的算法,以最小化标签之间的重叠。以下是一个简单的实现示例:
import matplotlib.pyplot as plt
import numpy as np

def adjust_labels(fig, ax, texts):
    """简单的标签位置调整算法"""
    positions = np.array([t.get_position() for t in texts])
    for i, (x, y) in enumerate(positions):
        for j, (x2, y2) in enumerate(positions):
            if i != j:
                dx, dy = x2 - x, y2 - y
                dist = np.sqrt(dx*dx + dy*dy)
                if dist < 0.1:  # 如果两个标签太近
                    angle = np.arctan2(dy, dx)
                    x += 0.05 * np.cos(angle)
                    y += 0.05 * np.sin(angle)
        texts[i].set_position((x, y))
    fig.canvas.draw()

# 准备数据
sizes = [15, 30, 45, 10, 20, 25, 5]
labels = ['how2matplotlib.com A', 'how2matplotlib.com B', 'how2matplotlib.com C',
          'how2matplotlib.com D', 'how2matplotlib.com E', 'how2matplotlib.com F',
          'how2matplotlib.com G']

# 创建饼图
fig, ax = plt.subplots(figsize=(10, 8))
wedges, texts, autotexts = ax.pie(sizes, labels=labels, autopct='%1.1f%%')

# 调整标签位置
adjust_labels(fig, ax, texts)

plt.title("Pie Chart with Automatic Label Adjustment")
plt.show()
Output:
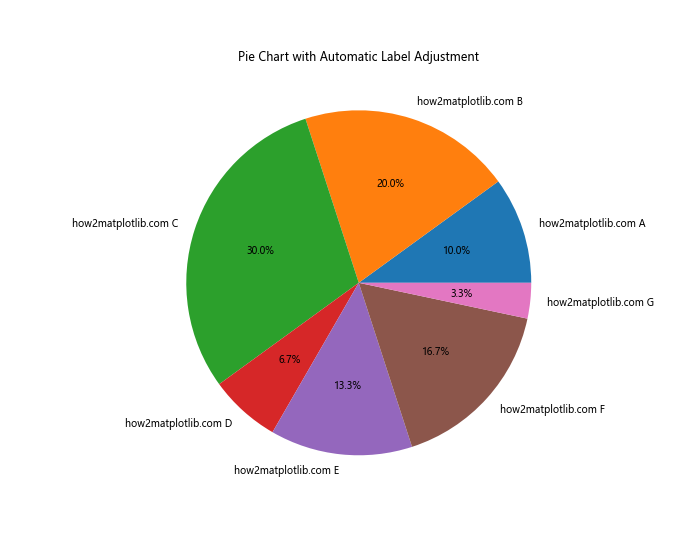
这个例子中,我们定义了一个adjust_labels函数,它会检查所有标签的位置,如果发现两个标签太近,就会稍微移动它们的位置。这种方法可以自动处理标签重叠的问题,特别适用于数据项较多的情况。
12. 使用交互式标签
对于一些复杂的数据可视化需求,我们可以考虑使用交互式标签。这种方法可以在初始状态下隐藏所有标签,只有当用户将鼠标悬停在某个扇形上时才显示相应的标签。这种方法可以完全避免标签重叠的问题,同时还能提供更好的用户体验。
import matplotlib.pyplot as plt
from matplotlib.patches import Circle

class InteractivePie:
    def __init__(self, sizes, labels):
        self.sizes = sizes
        self.labels = labels
        self.fig, self.ax = plt.subplots(figsize=(10, 8))
        self.wedges, _ = self.ax.pie(sizes, wedgeprops=dict(width=0.5))
        self.selected = None
        self.annotation = self.ax.annotate("", xy=(0,0), xytext=(20,20),
                                           textcoords="offset points",
                                           bbox=dict(boxstyle="round", fc="w"),
                                           arrowprops=dict(arrowstyle="->"))
        self.annotation.set_visible(False)
        self.fig.canvas.mpl_connect("motion_notify_event", self.hover)

    def hover(self, event):
        if event.inaxes == self.ax:
            for i, wedge in enumerate(self.wedges):
                if wedge.contains_point([event.x, event.y]):
                    self.select(i)
                    return
        self.unselect()

    def select(self, index):
        if self.selected is not None:
            self.wedges[self.selected].set_radius(1.0)
        self.selected = index
        self.wedges[index].set_radius(1.1)
        self.show_annotation(index)
        self.fig.canvas.draw_idle()

    def unselect(self):
        if self.selected is not None:
            self.wedges[self.selected].set_radius(1.0)
        self.selected = None
        self.annotation.set_visible(False)
        self.fig.canvas.draw_idle()

    def show_annotation(self, index):
        wedge = self.wedges[index]
        center = wedge.center
        angle = (wedge.theta1 + wedge.theta2) / 2
        x = center[0] + np.cos(np.deg2rad(angle))
        y = center[1] + np.sin(np.deg2rad(angle))
        self.annotation.xy = (x, y)
        self.annotation.set_text(f"{self.labels[index]}\n{self.sizes[index]}%")
        self.annotation.set_visible(True)

# 准备数据
sizes = [15, 30, 45, 10, 20, 25, 5]
labels = ['how2matplotlib.com A', 'how2matplotlib.com B', 'how2matplotlib.com C',
          'how2matplotlib.com D', 'how2matplotlib.com E', 'how2matplotlib.com F',
          'how2matplotlib.com G']

# 创建交互式饼图
interactive_pie = InteractivePie(sizes, labels)
plt.title("Interactive Pie Chart")
plt.show()
Output:
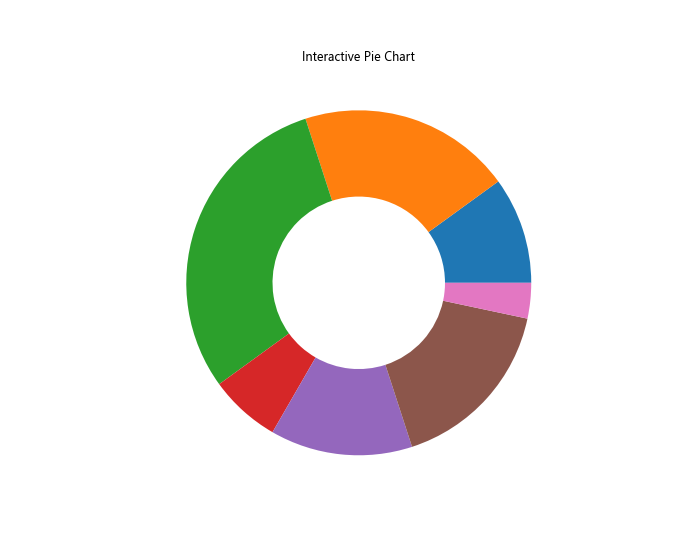
这个例子中,我们创建了一个InteractivePie类,它实现了交互式饼图的功能。当用户将鼠标悬停在某个扇形上时,该扇形会稍微突出,并显示相应的标签信息。这种方法不仅避免了标签重叠的问题,还提供了更丰富的交互体验。
13. 使用颜色编码替代部分标签
对于数据项非常多的情况,我们可以考虑使用颜色编码来替代部分标签。这种方法可以大大减少图表中的文字数量,从而减少标签重叠的问题。
import matplotlib.pyplot as plt
import numpy as np

# 准备数据
sizes = np.random.randint(1, 100, 20)
labels = [f'how2matplotlib.com {chr(65+i)}' for i in range(20)]

# 创建颜色映射
cmap = plt.get_cmap('tab20')
colors = cmap(np.linspace(0, 1, len(sizes)))

# 创建饼图
fig, ax = plt.subplots(figsize=(12, 8))
wedges, texts, autotexts = ax.pie(sizes, colors=colors, autopct='%1.1f%%', pctdistance=0.85)

# 创建图例
ax.legend(wedges, labels, title="Categories", loc="center left", bbox_to_anchor=(1, 0, 0.5, 1))

plt.title("Pie Chart with Color Coding")
plt.tight_layout()
plt.show()
Output:
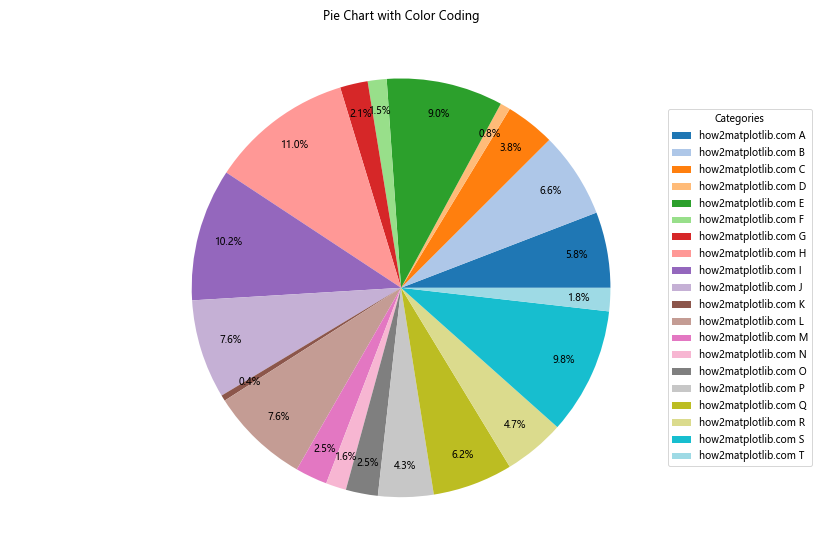
在这个例子中,我们使用了20种不同的颜色来表示20个不同的类别。我们没有直接在饼图上标注标签,而是使用了图例来显示每种颜色对应的类别。这种方法可以有效地处理大量数据项,同时避免标签重叠的问题。
14. 使用分离的子图表示小比例数据
对于那些比例非常小的数据项,我们可以考虑将它们单独放在一个子图中显示。这种方法可以让主饼图更加清晰,同时也能确保小比例数据得到适当的展示。
import matplotlib.pyplot as plt

# 准备数据
sizes = [45, 30, 15, 5, 3, 2]
labels = ['how2matplotlib.com A', 'how2matplotlib.com B', 'how2matplotlib.com C',
          'how2matplotlib.com D', 'how2matplotlib.com E', 'how2matplotlib.com F']

# 定义阈值
threshold = 5

# 分离数据
main_sizes = [size for size in sizes if size >= threshold]
main_labels = [label for size, label in zip(sizes, labels) if size >= threshold]
other_sizes = [size for size in sizes if size < threshold]
other_labels = [label for size, label in zip(sizes, labels) if size < threshold]

# 创建图表
fig, (ax1, ax2) = plt.subplots(1, 2, figsize=(15, 8))

# 绘制主饼图
ax1.pie(main_sizes, labels=main_labels, autopct='%1.1f%%', startangle=90)
ax1.set_title('Main Categories')

# 绘制其他类别的饼图
ax2.pie(other_sizes, labels=other_labels, autopct='%1.1f%%', startangle=90)
ax2.set_title('Other Categories (< 5%)')

plt.suptitle("Pie Charts with Separated Small Proportions")
plt.tight_layout()
plt.show()
Output:
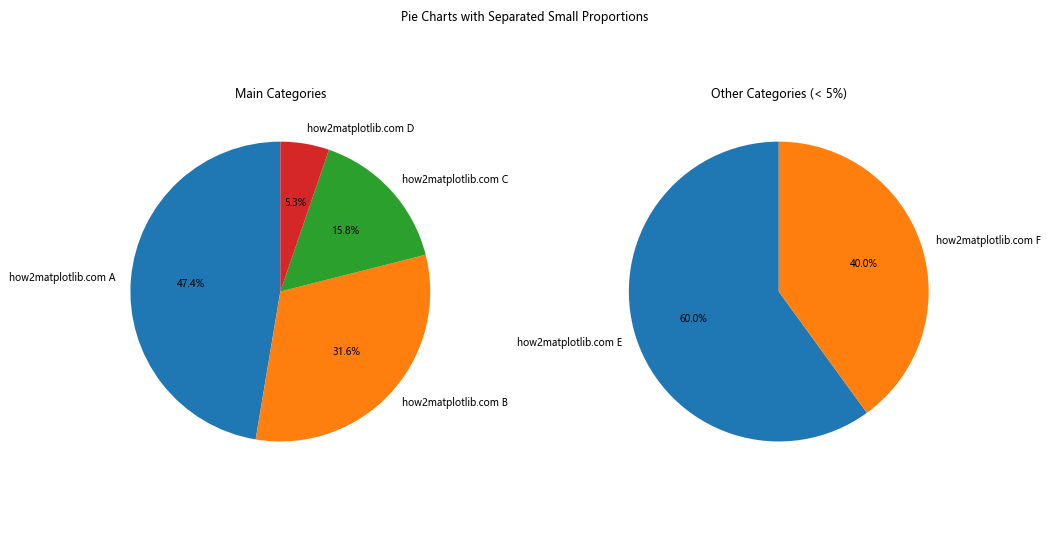
在这个例子中,我们将比例小于5%的数据项单独放在一个子图中显示。这种方法可以让主饼图更加清晰,同时也能确保小比例数据得到适当的展示,有效避免了标签重叠的问题。
15. 使用环形图代替饼图
环形图(也称为圆环图)是饼图的一种变体,它在中心有一个空白区域。这种图表形式可以为标签提供更多的空间,从而减少标签重叠的问题。
import matplotlib.pyplot as plt

# 准备数据
sizes = [15, 30, 45, 10, 20, 25, 5]
labels = ['how2matplotlib.com A', 'how2matplotlib.com B', 'how2matplotlib.com C',
          'how2matplotlib.com D', 'how2matplotlib.com E', 'how2matplotlib.com F',
          'how2matplotlib.com G']

# 创建环形图
fig, ax = plt.subplots(figsize=(10, 8))
wedges, texts, autotexts = ax.pie(sizes, labels=labels, autopct='%1.1f%%',
                                  pctdistance=0.85, wedgeprops=dict(width=0.5))

# 添加中心圆以创建环形效果
centre_circle = plt.Circle((0,0), 0.70, fc='white')
fig.gca().add_artist(centre_circle)

plt.title("Donut Chart")
plt.tight_layout()
plt.show()
Output:
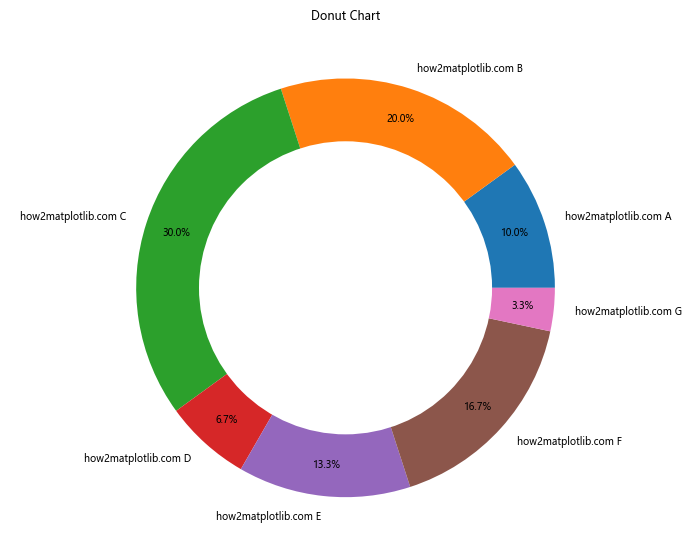
在这个例子中,我们通过设置wedgeprops=dict(width=0.5)来创建环形图,并添加了一个白色的中心圆来增强环形效果。环形图为标签提供了更多的空间,可以有效减少标签重叠的问题。
结论
解决Matplotlib饼图中标签重叠的问题有多种方法,每种方法都有其适用的场景。从简单的调整图表大小和布局,到使用更复杂的交互式标签或自动调整算法,我们可以根据具体的数据特征和可视化需求选择最合适的方法。
在实际应用中,我们可能需要结合多种方法来获得最佳的可视化效果。例如,我们可以先使用环形图来为标签提供更多空间,然后使用颜色编码来减少文字数量,最后再应用自动标签位置调整算法来微调标签位置。
此外,我们还应该考虑数据的特性和受众的需求。对于数据项较少的情况,直接在饼图上标注可能就足够了。但对于数据项较多或者有层次结构的数据,使用嵌套饼图或者将小比例数据分离出来可能会更合适。
最后,我们还应该记住,虽然饼图是一种常用的数据可视化方式,但它并不总是最佳选择。对于某些类型的数据,使用条形图、堆叠条形图或者其他类型的图表可能会更加清晰和有效。因此,在选择使用饼图之前,我们应该先仔细考虑数据的性质和我们想要传达的信息。
总的来说,解决Matplotlib饼图标签重叠问题需要我们灵活运用各种技巧和方法,同时也要考虑到数据可视化的基本原则。通过合理的设计和适当的技术应用,我们可以创建出既美观又信息丰富的饼图,有效地传达数据中的关键信息。
16. 使用半径不同的多层饼图
对于具有层次结构的数据,我们可以使用半径不同的多层饼图来展示。这种方法不仅可以展示更多的信息,还可以有效地避免标签重叠的问题。
import matplotlib.pyplot as plt
import numpy as np

# 准备数据
sizes_outer = [30, 70]
labels_outer = ['how2matplotlib.com Group A', 'how2matplotlib.com Group B']
sizes_inner = [15, 15, 30, 40]
labels_inner = ['how2matplotlib.com A1', 'how2matplotlib.com A2', 'how2matplotlib.com B1', 'how2matplotlib.com B2']

# 创建图表
fig, ax = plt.subplots(figsize=(10, 8))

# 绘制外层饼图
outer_colors = ['#ff9999', '#66b3ff']
outer_wedges, outer_texts = ax.pie(sizes_outer, labels=labels_outer, colors=outer_colors,
                                   radius=1, wedgeprops=dict(width=0.3, edgecolor='white'))

# 绘制内层饼图
inner_colors = ['#ff9999', '#ffcc99', '#66b3ff', '#99ff99']
inner_wedges, inner_texts = ax.pie(sizes_inner, labels=labels_inner, colors=inner_colors,
                                   radius=0.7, wedgeprops=dict(width=0.4, edgecolor='white'))

# 添加标题
ax.set_title("Multi-layer Pie Chart with Different Radii")

plt.show()
Output:
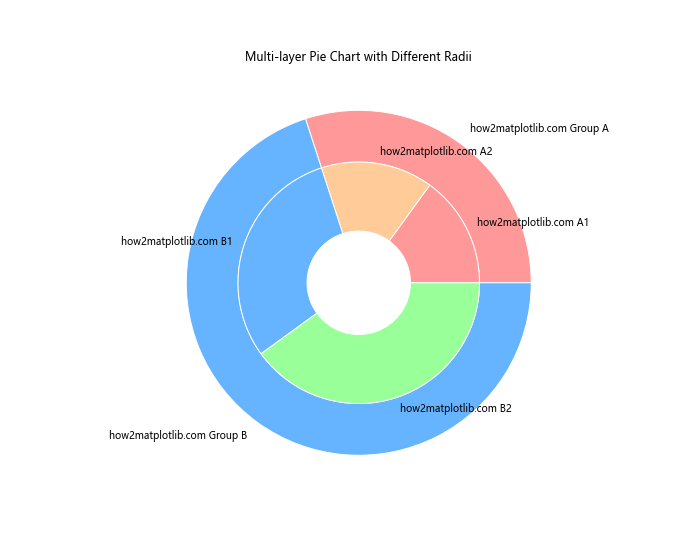
在这个例子中,我们创建了两个半径不同的饼图层。外层饼图展示了主要分类,内层饼图则展示了更详细的子分类。这种方法可以在一个图表中展示更多的信息,同时通过调整不同层的半径来避免标签重叠。
17. 使用极坐标散点图代替饼图
对于某些类型的数据,我们可以考虑使用极坐标散点图来代替传统的饼图。这种方法可以更灵活地处理标签位置,同时还能展示额外的数据维度。
import matplotlib.pyplot as plt
import numpy as np

# 准备数据
categories = ['how2matplotlib.com A', 'how2matplotlib.com B', 'how2matplotlib.com C',
              'how2matplotlib.com D', 'how2matplotlib.com E', 'how2matplotlib.com F']
values = [15, 30, 45, 10, 20, 25]
additional_values = [5, 15, 25, 8, 12, 18]

# 计算角度和半径
angles = np.linspace(0, 2*np.pi, len(categories), endpoint=False)
values = np.array(values)

# 创建极坐标图
fig, ax = plt.subplots(figsize=(10, 8), subplot_kw=dict(projection='polar'))

# 绘制散点图
scatter = ax.scatter(angles, values, s=additional_values*20, c=angles, cmap='hsv', alpha=0.75)

# 设置角度刻度
ax.set_xticks(angles)
ax.set_xticklabels(categories)

# 添加值标签
for angle, value, label in zip(angles, values, categories):
    ax.text(angle, value, f'{value}', ha='center', va='center')

# 设置标题
plt.title('Polar Scatter Plot as an Alternative to Pie Chart')

# 添加颜色条
plt.colorbar(scatter)

plt.tight_layout()
plt.show()
在这个例子中,我们使用极坐标散点图来代替传统的饼图。每个点的角度位置代表类别,距离中心的距离代表数值大小,而点的大小则代表了一个额外的数据维度。这种方法不仅避免了标签重叠的问题,还能展示更多的信息。
18. 使用动态标签
对于复杂的数据集,我们可以考虑使用动态标签。这种方法可以在用户交互时显示或隐藏标签,从而避免静态标签可能带来的重叠问题。
import matplotlib.pyplot as plt
from matplotlib.widgets import Button

class DynamicPie:
    def __init__(self, sizes, labels):
        self.sizes = sizes
        self.labels = labels
        self.fig, self.ax = plt.subplots(figsize=(10, 8))
        self.wedges, self.texts = self.ax.pie(sizes, labels=None, autopct='%1.1f%%')
        self.ax.set_title("Dynamic Pie Chart")

        self.button_ax = plt.axes([0.81, 0.05, 0.1, 0.075])
        self.button = Button(self.button_ax, 'Toggle Labels')
        self.button.on_clicked(self.toggle_labels)

        self.labels_visible = False

    def toggle_labels(self, event):
        self.labels_visible = not self.labels_visible
        for text, label in zip(self.texts, self.labels):
            if self.labels_visible:
                text.set_text(label)
            else:
                text.set_text('')
        self.fig.canvas.draw()

# 准备数据
sizes = [15, 30, 45, 10, 20, 25, 5]
labels = ['how2matplotlib.com A', 'how2matplotlib.com B', 'how2matplotlib.com C',
          'how2matplotlib.com D', 'how2matplotlib.com E', 'how2matplotlib.com F',
          'how2matplotlib.com G']

# 创建动态饼图
dynamic_pie = DynamicPie(sizes, labels)
plt.show()
在这个例子中,我们创建了一个带有切换按钮的动态饼图。用户可以通过点击按钮来显示或隐藏标签。这种方法可以让用户在需要时查看详细信息,同时在默认状态下保持图表的整洁。
19. 使用文本换行来缩短标签
有时,标签重叠的问题可能是由于标签文本太长造成的。在这种情况下,我们可以考虑使用文本换行来缩短标签的宽度。
import matplotlib.pyplot as plt
import textwrap

# 准备数据
sizes = [15, 30, 45, 10]
labels = ['how2matplotlib.com Category A', 'how2matplotlib.com Category B',
          'how2matplotlib.com Category C', 'how2matplotlib.com Category D']

# 创建一个函数来换行文本
def wrap_labels(labels, max_width=10):
    return [textwrap.fill(label, max_width) for label in labels]

# 换行标签
wrapped_labels = wrap_labels(labels)

# 创建饼图
fig, ax = plt.subplots(figsize=(10, 8))
wedges, texts, autotexts = ax.pie(sizes, labels=wrapped_labels, autopct='%1.1f%%')

plt.title("Pie Chart with Wrapped Labels")
plt.tight_layout()
plt.show()
Output:
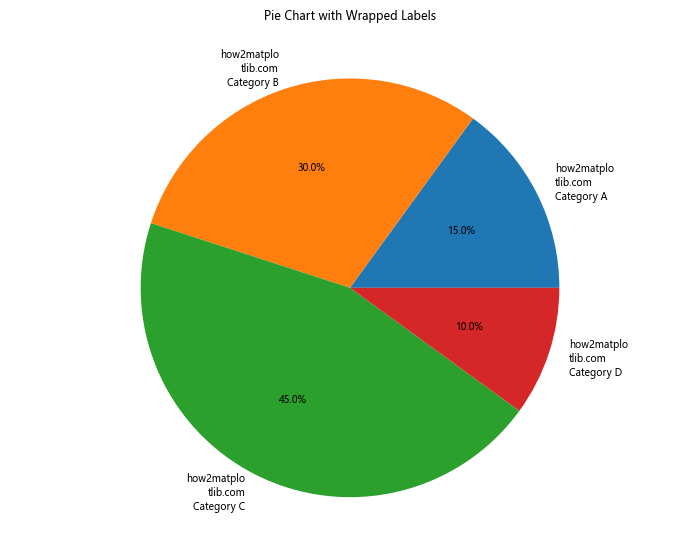
在这个例子中,我们定义了一个wrap_labels函数来将长标签文本换行。这种方法可以有效减少标签的宽度,从而减少重叠的可能性。
20. 使用标签连接线
对于某些复杂的情况,我们可以使用标签连接线来避免标签直接放置在饼图上。这种方法可以让我们更灵活地放置标签,有效避免重叠问题。
import matplotlib.pyplot as plt
import numpy as np

def make_autopct(values):
    def my_autopct(pct):
        total = sum(values)
        val = int(round(pct*total/100.0))
        return f'{pct:.1f}%\n({val:d})'
    return my_autopct

# 准备数据
sizes = [15, 30, 45, 10, 20, 25, 5]
labels = ['how2matplotlib.com A', 'how2matplotlib.com B', 'how2matplotlib.com C',
          'how2matplotlib.com D', 'how2matplotlib.com E', 'how2matplotlib.com F',
          'how2matplotlib.com G']

# 创建饼图
fig, ax = plt.subplots(figsize=(12, 8))
wedges, texts, autotexts = ax.pie(sizes, autopct=make_autopct(sizes),
                                  pctdistance=0.85, wedgeprops=dict(width=0.5))

# 添加连接线和标签
bbox_props = dict(boxstyle="round,pad=0.3", fc="w", ec="k", lw=0.72)
kw = dict(arrowprops=dict(arrowstyle="-"),
          bbox=bbox_props, zorder=0, va="center")

for i, p in enumerate(wedges):
    ang = (p.theta2 - p.theta1) / 2. + p.theta1
    y = np.sin(np.deg2rad(ang))
    x = np.cos(np.deg2rad(ang))
    horizontalalignment = {-1: "right", 1: "left"}[int(np.sign(x))]
    connectionstyle = f"angle,angleA=0,angleB={ang}"
    kw["arrowprops"].update({"connectionstyle": connectionstyle})
    ax.annotate(labels[i], xy=(x, y), xytext=(1.35*np.sign(x), 1.4*y),
                horizontalalignment=horizontalalignment, **kw)

plt.title("Pie Chart with Label Connectors")
plt.show()
Output:
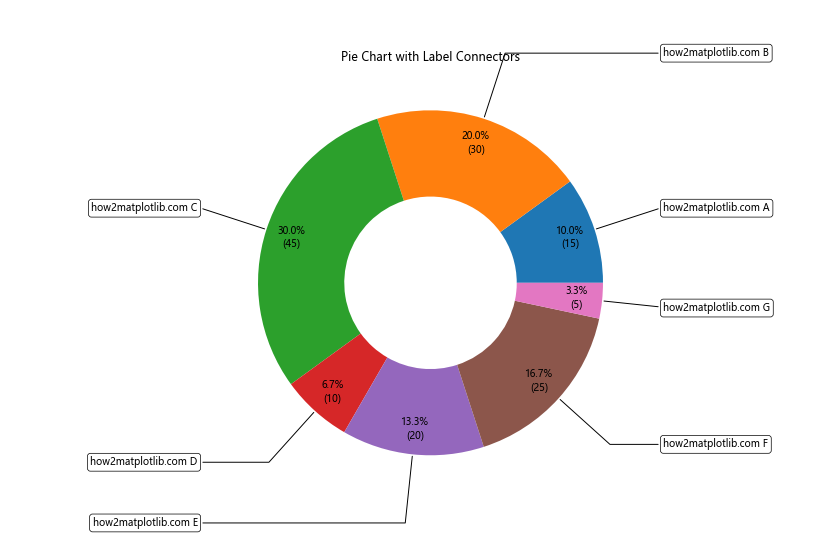
在这个例子中,我们使用了ax.annotate()函数来为每个扇形添加带有连接线的标签。这种方法可以让我们更自由地放置标签,有效避免重叠问题,同时还能通过连接线清晰地指示每个标签对应的扇形。
总结起来,解决Matplotlib饼图中标签重叠的问题需要我们根据具体的数据特征和可视化需求,灵活运用各种技巧和方法。从简单的调整图表布局,到使用更复杂的交互式或动态标签,再到改变图表类型,我们有很多选择。关键是要在保持数据清晰可读的同时,创造出美观且信息丰富的可视化效果。通过不断实践和尝试,我们可以掌握这些技巧,创建出既美观又实用的数据可视化图表。
 极客教程
极客教程