Matplotlib饼图图例:如何创建和自定义饼图及其图例
参考:matplotlib pie chart legend
Matplotlib是Python中最流行的数据可视化库之一,它提供了强大的工具来创建各种类型的图表,包括饼图。饼图是一种圆形统计图形,用于显示数据的比例关系。在本文中,我们将深入探讨如何使用Matplotlib创建饼图,并重点关注如何添加和自定义图例。我们将涵盖从基础到高级的各种技巧,帮助你掌握饼图和图例的创建与定制。
1. 基础饼图的创建
首先,让我们从创建一个基本的饼图开始。饼图通常用于显示各部分占整体的比例。以下是一个简单的例子:
import matplotlib.pyplot as plt

# 数据
sizes = [30, 25, 20, 15, 10]
labels = ['A', 'B', 'C', 'D', 'E']

# 创建饼图
plt.pie(sizes, labels=labels)
plt.title('How2matplotlib.com Basic Pie Chart')
plt.axis('equal')  # 确保饼图是圆的
plt.show()
Output:
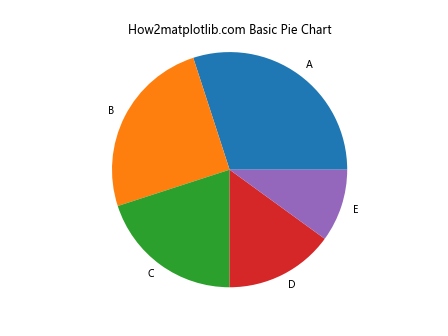
在这个例子中,我们使用plt.pie()函数创建了一个基本的饼图。sizes参数指定了每个扇区的大小,labels参数为每个扇区提供标签。plt.axis('equal')确保饼图是圆形的,而不是椭圆形。
2. 添加图例
虽然直接在饼图上标注标签很有用,但有时我们可能希望使用单独的图例来提供更清晰的信息。以下是如何添加图例的示例:
import matplotlib.pyplot as plt

sizes = [30, 25, 20, 15, 10]
labels = ['Apple', 'Banana', 'Cherry', 'Date', 'Elderberry']
colors = ['red', 'yellow', 'purple', 'brown', 'blue']

plt.pie(sizes, labels=labels, colors=colors, autopct='%1.1f%%', startangle=90)
plt.title('How2matplotlib.com Fruit Preferences')
plt.axis('equal')
plt.legend(title="Fruits", loc="center left", bbox_to_anchor=(1, 0, 0.5, 1))
plt.show()
Output:
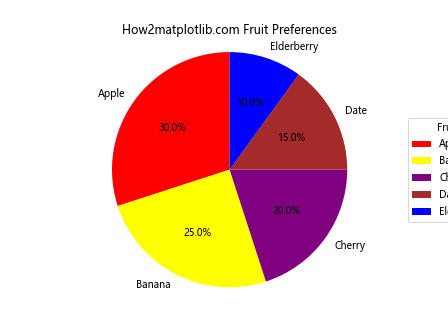
在这个例子中,我们使用plt.legend()函数添加了图例。title参数设置图例的标题,loc参数指定图例的位置,bbox_to_anchor参数用于微调图例的位置。
3. 自定义图例样式
Matplotlib允许我们对图例的样式进行广泛的自定义。以下是一个展示如何自定义图例样式的示例:
import matplotlib.pyplot as plt

sizes = [40, 30, 20, 10]
labels = ['Dogs', 'Cats', 'Birds', 'Fish']
colors = ['#ff9999', '#66b3ff', '#99ff99', '#ffcc99']
explode = (0.1, 0, 0, 0)  # 突出显示第一个扇区

plt.pie(sizes, explode=explode, labels=labels, colors=colors, autopct='%1.1f%%', startangle=90)
plt.title('How2matplotlib.com Pet Preferences')
plt.axis('equal')
plt.legend(title="Pets", loc="center left", bbox_to_anchor=(1, 0, 0.5, 1),
           fancybox=True, shadow=True, ncol=1)
plt.show()
Output:
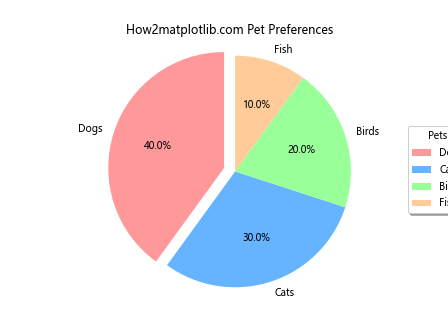
在这个例子中,我们使用了fancybox=True来给图例添加圆角,shadow=True来添加阴影效果,ncol=1来设置图例的列数。
4. 图例中显示百分比
有时,我们可能希望在图例中显示每个类别的百分比。以下是如何实现这一点的示例:
import matplotlib.pyplot as plt

sizes = [35, 30, 20, 15]
labels = ['Product A', 'Product B', 'Product C', 'Product D']
colors = ['#ff9999', '#66b3ff', '#99ff99', '#ffcc99']

def make_autopct(values):
    def my_autopct(pct):
        total = sum(values)
        val = int(round(pct*total/100.0))
        return f'{pct:.1f}%\n({val:d})'
    return my_autopct

plt.pie(sizes, labels=labels, colors=colors, autopct=make_autopct(sizes), startangle=90)
plt.title('How2matplotlib.com Product Sales')
plt.axis('equal')
plt.legend(title="Products", loc="center left", bbox_to_anchor=(1, 0, 0.5, 1))
plt.show()
Output:
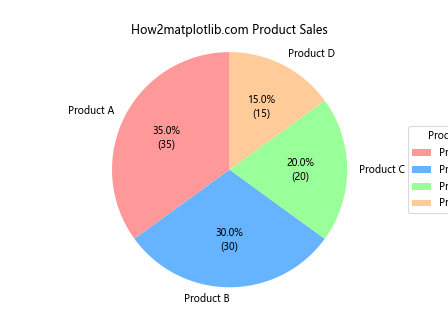
在这个例子中,我们定义了一个自定义函数make_autopct,它返回一个函数,该函数同时显示百分比和实际数值。
5. 创建嵌套饼图
嵌套饼图(也称为环形图)可以用来显示多层次的数据。以下是一个创建嵌套饼图的示例:
import matplotlib.pyplot as plt

# 外圈数据
sizes_outer = [40, 30, 30]
labels_outer = ['Fruits', 'Vegetables', 'Grains']
colors_outer = ['#ff9999', '#66b3ff', '#99ff99']

# 内圈数据
sizes_inner = [15, 25, 35, 25]
labels_inner = ['Apples', 'Bananas', 'Carrots', 'Bread']
colors_inner = ['#ff7777', '#4499ff', '#77ff77', '#ffaa77']

fig, ax = plt.subplots()

ax.pie(sizes_outer, labels=labels_outer, colors=colors_outer, autopct='%1.1f%%', startangle=90, radius=1)
ax.pie(sizes_inner, labels=labels_inner, colors=colors_inner, autopct='%1.1f%%', startangle=90, radius=0.7)

plt.title('How2matplotlib.com Food Categories')
ax.axis('equal')
plt.legend(title="Food Types", loc="center left", bbox_to_anchor=(1, 0, 0.5, 1))
plt.show()
Output:
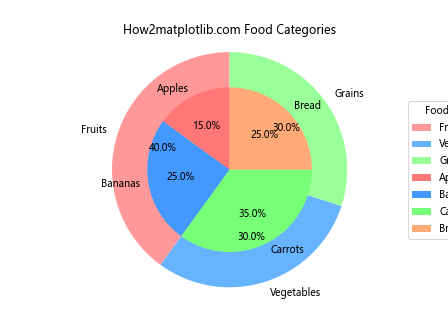
在这个例子中,我们创建了两个饼图,一个较大的外圈和一个较小的内圈。通过调整radius参数,我们可以控制每个饼图的大小。
6. 自定义扇区颜色和样式
Matplotlib提供了多种方式来自定义饼图的外观。以下是一个展示如何自定义扇区颜色和样式的示例:
import matplotlib.pyplot as plt

sizes = [30, 25, 20, 15, 10]
labels = ['A', 'B', 'C', 'D', 'E']
colors = ['#ff9999', '#66b3ff', '#99ff99', '#ffcc99', '#ff99cc']
explode = (0.1, 0, 0, 0, 0)

plt.pie(sizes, explode=explode, labels=labels, colors=colors,
        autopct='%1.1f%%', startangle=90, shadow=True, wedgeprops={'edgecolor': 'black'})
plt.title('How2matplotlib.com Custom Pie Chart')
plt.axis('equal')
plt.legend(title="Categories", loc="center left", bbox_to_anchor=(1, 0, 0.5, 1))
plt.show()
Output:
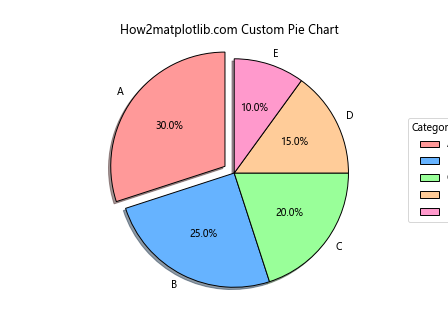
在这个例子中,我们使用explode参数来突出显示第一个扇区,shadow=True添加阴影效果,wedgeprops参数用于设置扇区的边框颜色。
7. 图例位置的调整
图例的位置对于整体图表的布局非常重要。以下是一个展示如何精确调整图例位置的示例:
import matplotlib.pyplot as plt

sizes = [35, 30, 20, 15]
labels = ['Category A', 'Category B', 'Category C', 'Category D']
colors = ['#ff9999', '#66b3ff', '#99ff99', '#ffcc99']

fig, ax = plt.subplots(figsize=(10, 6))
ax.pie(sizes, labels=labels, colors=colors, autopct='%1.1f%%', startangle=90)
ax.set_title('How2matplotlib.com Pie Chart with Adjusted Legend')
ax.axis('equal')

# 调整图例位置
plt.legend(title="Categories", loc="center left", bbox_to_anchor=(1, 0.5))

# 调整布局以适应图例
plt.tight_layout()
plt.show()
Output:
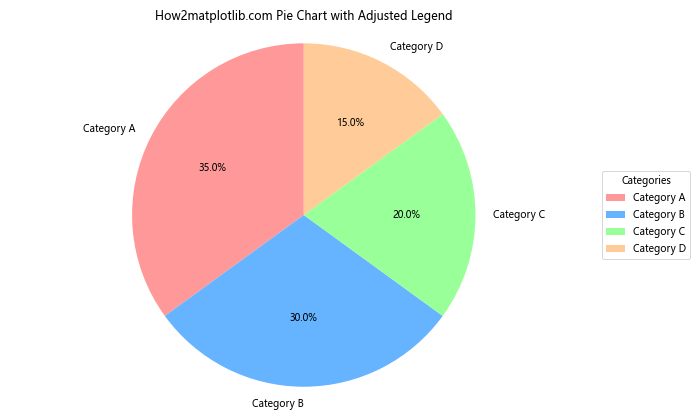
在这个例子中,我们使用bbox_to_anchor=(1, 0.5)将图例放置在饼图的右侧中央。plt.tight_layout()函数用于自动调整子图参数,以给予指定的填充。
8. 创建半圆形饼图
有时,使用半圆形的饼图可以提供更有趣的视觉效果。以下是创建半圆形饼图的示例:
import matplotlib.pyplot as plt

sizes = [30, 25, 20, 15, 10]
labels = ['A', 'B', 'C', 'D', 'E']
colors = ['#ff9999', '#66b3ff', '#99ff99', '#ffcc99', '#ff99cc']

fig, ax = plt.subplots()
ax.pie(sizes, labels=labels, colors=colors, autopct='%1.1f%%', startangle=-90, counterclock=False)
ax.set_title('How2matplotlib.com Semi-circle Pie Chart')
ax.axis('equal')

# 设置y轴限制以创建半圆形
plt.ylim(-1.1, 1.1)

plt.legend(title="Categories", loc="center left", bbox_to_anchor=(1, 0, 0.5, 1))
plt.show()
Output:
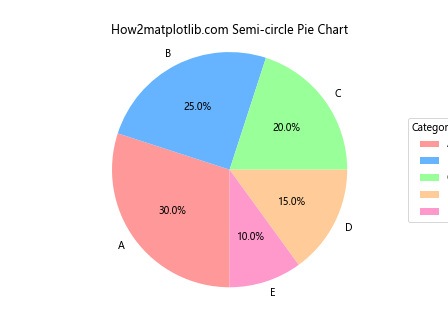
在这个例子中,我们通过设置startangle=-90和counterclock=False来创建一个从右侧开始的半圆形饼图。plt.ylim(-1.1, 1.1)用于裁剪下半部分。
9. 添加子图标题
当创建多个饼图时,为每个子图添加标题可以提供更清晰的信息。以下是一个示例:
import matplotlib.pyplot as plt

# 数据
sizes1 = [40, 30, 30]
labels1 = ['A', 'B', 'C']
sizes2 = [35, 25, 40]
labels2 = ['X', 'Y', 'Z']

fig, (ax1, ax2) = plt.subplots(1, 2, figsize=(12, 5))

# 第一个饼图
ax1.pie(sizes1, labels=labels1, autopct='%1.1f%%', startangle=90)
ax1.set_title('How2matplotlib.com Chart 1')

# 第二个饼图
ax2.pie(sizes2, labels=labels2, autopct='%1.1f%%', startangle=90)
ax2.set_title('How2matplotlib.com Chart 2')

# 添加总标题
fig.suptitle('Comparison of Two Datasets', fontsize=16)

plt.tight_layout()
plt.show()
Output:
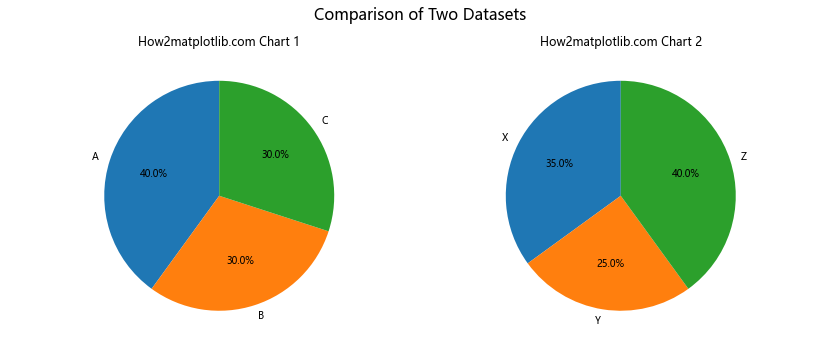
在这个例子中,我们创建了两个并排的饼图,每个饼图都有自己的标题。fig.suptitle()用于添加总标题。
10. 使用自定义字体和样式
自定义字体和样式可以使你的饼图更具个性化。以下是一个使用自定义字体和样式的示例:
import matplotlib.pyplot as plt
import matplotlib.font_manager as fm

# 加载自定义字体(请确保你有这个字体文件)
prop = fm.FontProperties(fname='path/to/your/font.ttf')

sizes = [30, 25, 20, 15, 10]
labels = ['A', 'B', 'C', 'D', 'E']
colors = ['#ff9999', '#66b3ff', '#99ff99', '#ffcc99', '#ff99cc']

plt.figure(figsize=(10, 8))
plt.pie(sizes, labels=labels, colors=colors, autopct='%1.1f%%', startangle=90,
        textprops={'fontproperties': prop, 'color': 'white', 'weight': 'bold', 'size': 14})
plt.title('How2matplotlib.com Custom Font Pie Chart', fontproperties=prop, fontsize=20)
plt.axis('equal')

plt.legend(title="Categories", loc="center left", bbox_to_anchor=(1, 0, 0.5, 1),
           prop=prop, title_fontproperties=prop)
plt.show()
在这个例子中,我们使用FontProperties来加载自定义字体,并将其应用于饼图的标签、百分比文本、标题和图例。
11. 创建动态饼图
虽然Matplotlib主要用于静态图表,但我们也可以创建简单的动画效果。以下是一个创建动态饼图的示例:
import matplotlib.pyplot as plt
import matplotlib.animation as animation

def update(num):
    ax.clear()
    sizes = [30+num, 30-num, 40]
    ax.pie(sizes, labels=['A', 'B', 'C'], autopct='%1.1f%%', startangle=90)
    ax.set_title(f'How2matplotlib.com Frame {num}')

fig, ax = plt.subplots()
ani = animation.FuncAnimation(fig, update, frames=range(30), repeat=True)
plt.show()
Output:
在这个例子中,我们使用animation.FuncAnimation创建了一个简单的动画,其中饼图的大小随时间变化。
12. 添加图像到饼图中心
有时,在饼图的中心添加一个图像可以增加视觉吸引力。以下是一个示例:
import matplotlib.pyplot as plt
import numpy as np

sizes = [30, 25, 20, 15, 10]
labels = ['A', 'B', 'C', 'D', 'E']
colors = ['#ff9999', '#66b3ff', '#99ff99', '#ffcc99', '#ff99cc']

# 创建一个圆形的图像数据
center_image = np.zeros((100, 100, 4))
center_image[:,:,0] = 1  # 红色通道
center_image[:,:,3] = 1  # Alpha通道
y, x = np.ogrid[-50:50, -50:50]
mask = x*x + y*y <= 50*50
center_image[mask] = [1, 1, 1, 1]  # 白色圆形

fig, ax = plt.subplots()
ax.pie(sizes, labels=labels, colors=colors, autopct='%1.1f%%', startangle=90)
ax.set_title('How2matplotlib.com Pie Chart with Center Image')

# 添加中心图像
im = ax.imshow(center_image, extent=[-0.5, 0.5, -0.5, 0.5])

plt.axis('equal')
plt.show()
Output:
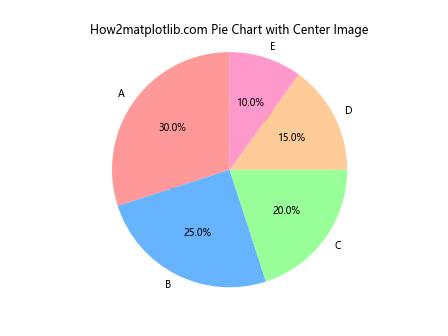
在这个例子中,我们创建了一个简单的圆形图像,并使用ax.imshow()将其添加到饼图的中心。extent参数用于控制图像的位置和大小。
13. 创建环形图
环形图是饼图的一种变体,中心有一个空洞。以下是创建环形图的示例:
import matplotlib.pyplot as plt

sizes = [30, 25, 20, 15, 10]
labels = ['A', 'B', 'C', 'D', 'E']
colors = ['#ff9999', '#66b3ff', '#99ff99', '#ffcc99', '#ff99cc']

fig, ax = plt.subplots()
ax.pie(sizes, labels=labels, colors=colors, autopct='%1.1f%%', startangle=90, pctdistance=0.85,
       wedgeprops=dict(width=0.5, edgecolor='white'))
ax.set_title('How2matplotlib.com Donut Chart')

# 添加一个圆圈来创建环形效果
centre_circle = plt.Circle((0,0),0.70,fc='white')
fig.gca().add_artist(centre_circle)

plt.axis('equal')
plt.show()
Output:
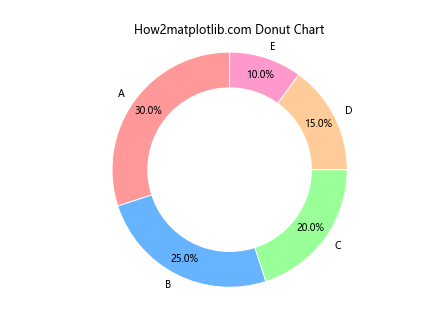
在这个例子中,我们使用wedgeprops参数来设置饼图扇区的宽度,并添加了一个白色的圆形来创建环形效果。
14. 使用极坐标系创建饼图
虽然通常我们使用plt.pie()函数来创建饼图,但也可以使用极坐标系来实现类似的效果。以下是一个示例:
import matplotlib.pyplot as plt
import numpy as np

# 数据
categories = ['A', 'B', 'C', 'D', 'E']
values = [30, 25, 20, 15, 10]

# 计算每个扇区的角度
angles = [i/sum(values) * 2 * np.pi for i in values]

# 累积角度
cumulative_angles = np.cumsum(angles)
start_angles = np.roll(cumulative_angles, 1)
start_angles[0] = 0

# 创建极坐标系
fig, ax = plt.subplots(subplot_kw=dict(projection='polar'))

# 绘制扇区
bars = ax.bar(
    x=(start_angles + angles/2),
    width=angles,
    height=0.8,
    bottom=0.1,
    linewidth=2,
    edgecolor='white',
)

# 添加标签
for bar, category in zip(bars, categories):
    angle = bar.get_x() + bar.get_width()/2
    ax.text(angle, 0.9, category, ha='center', va='center')

ax.set_title('How2matplotlib.com Polar Pie Chart')
ax.set_axis_off()

plt.show()
在这个例子中,我们使用ax.bar()函数在极坐标系中创建了类似饼图的效果。这种方法提供了更多的灵活性,允许我们自定义每个扇区的高度和位置。
15. 创建3D饼图
虽然2D饼图通常足够清晰,但有时3D效果可以增加视觉吸引力。以下是创建3D饼图的示例:
import matplotlib.pyplot as plt
import numpy as np

# 数据
sizes = [30, 25, 20, 15, 10]
labels = ['A', 'B', 'C', 'D', 'E']
colors = ['#ff9999', '#66b3ff', '#99ff99', '#ffcc99', '#ff99cc']

# 开始角度
start_angle = 0
angles = [start_angle + s/sum(sizes) * 360 for s in sizes]

# 创建3D图
fig = plt.figure(figsize=(10, 8))
ax = fig.add_subplot(111, projection='3d')

# 绘制饼图
for i, (size, label, color) in enumerate(zip(sizes, labels, colors)):
    end_angle = angles[i]
    x = np.linspace(start_angle, end_angle, 100)
    y = np.sin(np.radians(x))
    z = np.cos(np.radians(x))
    ax.plot(x, y, zs=0, zdir='z', color=color)
    ax.plot(x, y, zs=0.5, zdir='z', color=color)
    ax.plot([start_angle, start_angle], [0, 0], [0, 0.5], color=color)
    ax.plot([end_angle, end_angle], [0, 0], [0, 0.5], color=color)

    # 添加标签
    mid_angle = np.radians((start_angle + end_angle) / 2)
    ax.text(np.degrees(mid_angle), 1.1*np.sin(mid_angle), 1.1*np.cos(mid_angle),
            f'{label}\n{size}%', ha='center', va='center')

    start_angle = end_angle

ax.set_xlim(0, 360)
ax.set_ylim(-1.2, 1.2)
ax.set_zlim(0, 1)
ax.set_axis_off()

plt.title('How2matplotlib.com 3D Pie Chart')
plt.show()
Output:
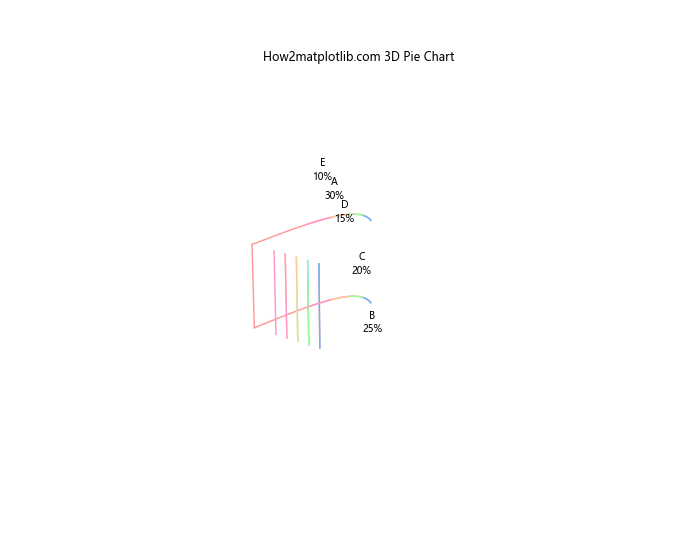
在这个例子中,我们使用3D投影创建了一个立体的饼图效果。通过绘制上下两个圆和连接它们的线条,我们创造了一个3D的视觉效果。
16. 创建嵌套的多层饼图
有时,我们需要展示多层次的数据结构。以下是创建嵌套的多层饼图的示例:
import matplotlib.pyplot as plt

# 数据
sizes_outer = [30, 30, 40]
sizes_middle = [15, 15, 10, 20, 20, 20]
sizes_inner = [5, 5, 5, 5, 5, 5, 10, 10, 10, 10, 10, 20]

labels_outer = ['Group A', 'Group B', 'Group C']
labels_middle = ['A1', 'A2', 'B1', 'B2', 'C1', 'C2']
labels_inner = ['a', 'b', 'c', 'd', 'e', 'f', 'g', 'h', 'i', 'j', 'k', 'l']

colors_outer = ['#ff9999', '#66b3ff', '#99ff99']
colors_middle = plt.cm.Pastel1(np.linspace(0, 1, 6))
colors_inner = plt.cm.Pastel2(np.linspace(0, 1, 12))

fig, ax = plt.subplots(figsize=(10, 10))

# 外圈
ax.pie(sizes_outer, labels=labels_outer, colors=colors_outer, radius=1,
       wedgeprops=dict(width=0.3, edgecolor='white'))

# 中圈
ax.pie(sizes_middle, labels=labels_middle, colors=colors_middle, radius=0.7,
       wedgeprops=dict(width=0.3, edgecolor='white'))

# 内圈
ax.pie(sizes_inner, labels=labels_inner, colors=colors_inner, radius=0.4,
       wedgeprops=dict(width=0.3, edgecolor='white'))

ax.set_title('How2matplotlib.com Multi-layer Pie Chart')

plt.show()
在这个例子中,我们创建了三层嵌套的饼图,每层代表不同级别的数据。通过调整每层的半径和宽度,我们可以清晰地展示多层次的数据结构。
17. 创建带有数据标签的饼图
有时,我们可能希望在饼图上显示更多的数据信息。以下是一个在饼图上添加详细数据标签的示例:
import matplotlib.pyplot as plt

# 数据
sizes = [30, 25, 20, 15, 10]
labels = ['A', 'B', 'C', 'D', 'E']
values = [300, 250, 200, 150, 100]

def make_autopct(values):
    def my_autopct(pct):
        total = sum(values)
        val = int(round(pct*total/100.0))
        return f'{pct:.1f}%\n({val:d})'
    return my_autopct

fig, ax = plt.subplots(figsize=(10, 8))

wedges, texts, autotexts = ax.pie(sizes, labels=labels, autopct=make_autopct(values),
                                  startangle=90, colors=plt.cm.Spectral.colors)

ax.set_title('How2matplotlib.com Pie Chart with Detailed Labels')

# 增加标签的可读性
for autotext in autotexts:
    autotext.set_fontsize(8)
    autotext.set_color('white')
    autotext.set_fontweight('bold')

plt.show()
在这个例子中,我们使用自定义函数make_autopct来创建包含百分比和实际值的标签。这种方法可以在饼图上直接显示更详细的信息。
18. 创建带有突出效果的饼图
为了强调某些特定的扇区,我们可以使用突出效果。以下是一个创建带有突出效果的饼图的示例:
import matplotlib.pyplot as plt

# 数据
sizes = [30, 25, 20, 15, 10]
labels = ['A', 'B', 'C', 'D', 'E']
explode = (0.1, 0, 0, 0, 0)  # 只突出显示第一个扇区

fig, ax = plt.subplots(figsize=(10, 8))

wedges, texts, autotexts = ax.pie(sizes, explode=explode, labels=labels, autopct='%1.1f%%',
                                  startangle=90, shadow=True, colors=plt.cm.Set3.colors)

ax.set_title('How2matplotlib.com Pie Chart with Exploded Sector')

# 添加图例
ax.legend(wedges, labels,
          title="Categories",
          loc="center left",
          bbox_to_anchor=(1, 0, 0.5, 1))

plt.setp(autotexts, size=8, weight="bold")

plt.show()
Output:
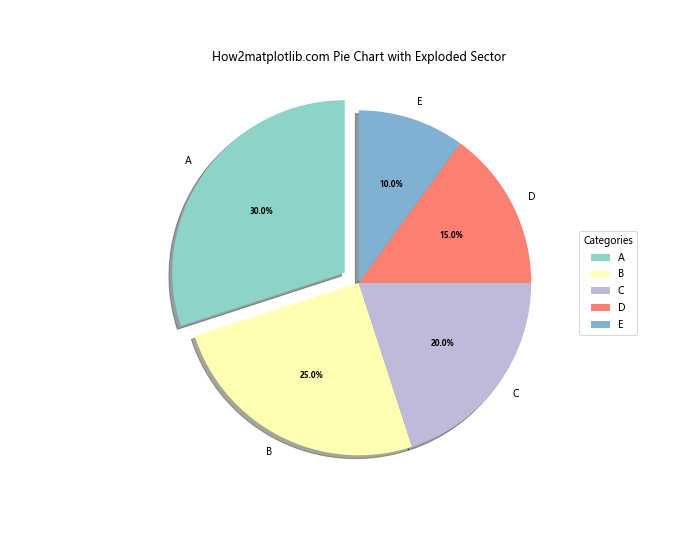
在这个例子中,我们使用explode参数来突出显示第一个扇区。shadow=True参数添加了阴影效果,增强了视觉吸引力。
19. 创建带有子扇区的饼图
有时,我们可能需要在主要扇区内显示更详细的子类别。以下是一个创建带有子扇区的饼图的示例:
import matplotlib.pyplot as plt
import numpy as np

# 主要类别数据
sizes = [40, 30, 30]
labels = ['Group A', 'Group B', 'Group C']

# 子类别数据
subgroup_sizes = [15, 25, 10, 20, 15, 15]
subgroup_labels = ['A1', 'A2', 'B1', 'B2', 'C1', 'C2']

# 颜色
main_colors = plt.cm.Pastel1(np.linspace(0, 1, 3))
subgroup_colors = plt.cm.Pastel2(np.linspace(0, 1, 6))

fig, (ax1, ax2) = plt.subplots(1, 2, figsize=(15, 8))

# 主饼图
wedges, texts, autotexts = ax1.pie(sizes, labels=labels, colors=main_colors, autopct='%1.1f%%',
                                   startangle=90, pctdistance=0.85)

# 子饼图
wedges2, texts2, autotexts2 = ax2.pie(subgroup_sizes, labels=subgroup_labels, colors=subgroup_colors,
                                      autopct='%1.1f%%', startangle=90, pctdistance=0.85)

ax1.set_title('How2matplotlib.com Main Categories')
ax2.set_title('How2matplotlib.com Subcategories')

# 添加图例
ax1.legend(wedges, labels, title="Main Groups", loc="center left", bbox_to_anchor=(1, 0, 0.5, 1))
ax2.legend(wedges2, subgroup_labels, title="Subgroups", loc="center left", bbox_to_anchor=(1, 0, 0.5, 1))

plt.tight_layout()
plt.show()
Output:
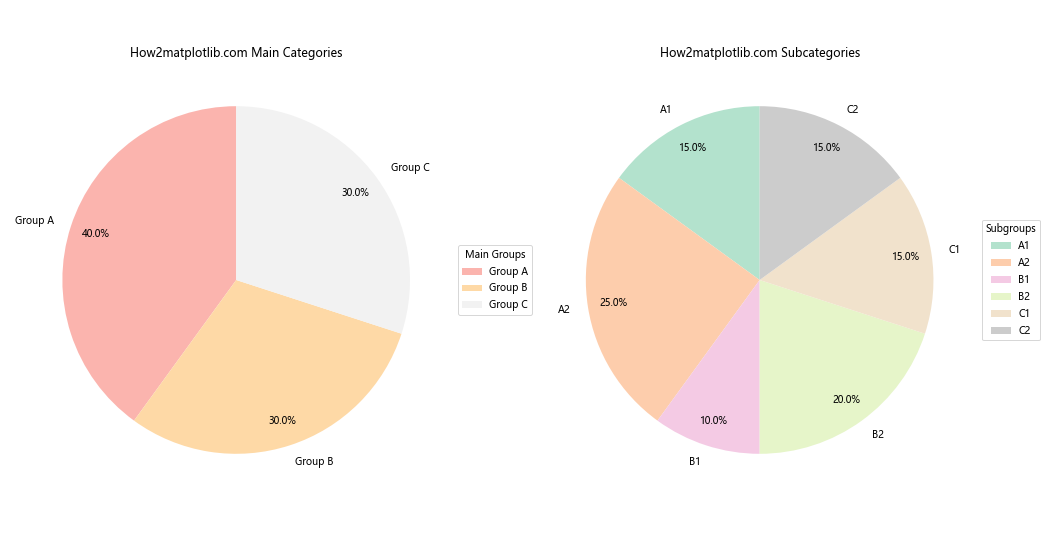
在这个例子中,我们创建了两个并排的饼图:一个显示主要类别,另一个显示子类别。这种方法可以有效地展示层次化的数据结构。
20. 创建带有趋势线的饼图
虽然不太常见,但有时我们可能希望在饼图中展示一些趋势或关系。以下是一个创建带有简单趋势线的饼图示例:
import matplotlib.pyplot as plt
import numpy as np

# 数据
sizes = [30,25, 20, 15, 10]
labels = ['A', 'B', 'C', 'D', 'E']
trend_values = [5, 4, 3, 2, 1]  # 假设的趋势值

fig, ax = plt.subplots(figsize=(10, 8))

# 创建饼图
wedges, texts, autotexts = ax.pie(sizes, labels=labels, autopct='%1.1f%%',
                                  startangle=90, colors=plt.cm.Spectral.colors)

# 添加趋势线
angles = np.linspace(0, 2*np.pi, len(sizes), endpoint=False)
trend_values = np.array(trend_values)
trend_values = (trend_values / trend_values.max()) * 0.5  # 归一化到0.5以内

ax.polar(angles, trend_values, 'r-', linewidth=2, label='Trend')
ax.fill(angles, trend_values, 'r', alpha=0.1)

ax.set_title('How2matplotlib.com Pie Chart with Trend Line')

# 添加图例
ax.legend(loc='upper right', bbox_to_anchor=(1.3, 1.1))

plt.tight_layout()
plt.show()
在这个例子中,我们在饼图上叠加了一个极坐标系的趋势线。这种方法可以在保持饼图基本结构的同时,展示额外的数据趋势或关系。
结论
通过本文,我们深入探讨了如何使用Matplotlib创建各种类型的饼图,并重点关注了图例的添加和自定义。我们涵盖了从基础的饼图创建到高级的自定义技巧,包括添加图例、自定义颜色和样式、创建嵌套和多层饼图、添加动画效果等。
饼图是数据可视化中一个强大的工具,特别适合展示部分与整体的关系。通过合理使用颜色、标签和图例,我们可以创建既美观又信息丰富的饼图。然而,需要注意的是,当数据类别过多时,饼图可能会变得难以阅读。在这种情况下,考虑使用其他类型的图表,如条形图或树状图,可能会更合适。
Matplotlib的灵活性使得我们可以根据具体需求定制饼图的各个方面。无论是简单的数据展示,还是复杂的多层次数据结构,Matplotlib都能够满足各种可视化需求。通过实践本文中的示例,读者可以掌握创建各种类型饼图的技能,并能够根据自己的数据和需求进行灵活调整。
最后,记住数据可视化的核心目的是有效传达信息。在创建饼图时,始终要考虑你的目标受众和你想要传达的主要信息。通过合理使用颜色、标签、图例和其他视觉元素,你可以创建既美观又富有洞察力的饼图,帮助你的受众更好地理解和解释数据。
 极客教程
极客教程