Matplotlib 图例位置设置:全面指南与实用技巧
Matplotlib 是 Python 中最流行的数据可视化库之一,它提供了强大而灵活的工具来创建各种类型的图表。在数据可视化中,图例(legend)是一个非常重要的元素,它帮助读者理解图表中不同数据系列的含义。本文将深入探讨 Matplotlib 中图例位置的设置,包括内置位置、自定义位置、图例样式调整等多个方面,帮助你掌握图例位置控制的各种技巧。
1. Matplotlib 图例基础
在开始探讨图例位置设置之前,我们先来了解一下 Matplotlib 中图例的基本用法。
1.1 添加图例
要在 Matplotlib 图表中添加图例,我们通常使用 legend() 方法。以下是一个简单的示例:
import matplotlib.pyplot as plt

plt.figure(figsize=(8, 6))
plt.plot([1, 2, 3, 4], [1, 4, 2, 3], label='Line 1')
plt.plot([1, 2, 3, 4], [2, 3, 4, 1], label='Line 2')
plt.title('How to add legend in Matplotlib - how2matplotlib.com')
plt.legend()
plt.show()
Output:
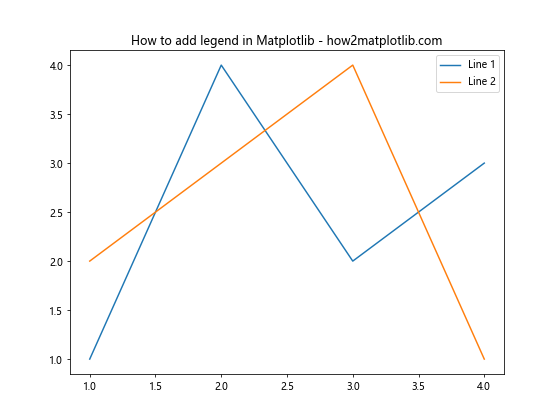
在这个例子中,我们创建了两条线,并为每条线设置了标签。通过调用 plt.legend(),Matplotlib 会自动创建一个包含这些标签的图例。
1.2 图例的组成部分
一个典型的 Matplotlib 图例由以下几个部分组成:
- 图例框:包含所有图例元素的边框
- 图例标题:可选的图例整体标题
- 图例项:每个数据系列的标识符,通常包括一个标记(如线条或点)和对应的标签文本
了解这些组成部分对于后续自定义图例位置和样式非常重要。
2. 使用内置位置设置图例
Matplotlib 提供了一系列预定义的位置来放置图例,这些位置通过字符串或数字代码来指定。
2.1 字符串位置
最常用的方法是使用字符串来指定图例位置。以下是一个示例:
import matplotlib.pyplot as plt

plt.figure(figsize=(8, 6))
plt.plot([1, 2, 3, 4], [1, 4, 2, 3], label='Data from how2matplotlib.com')
plt.title('Legend Position Example')
plt.legend(loc='upper right')
plt.show()
Output:
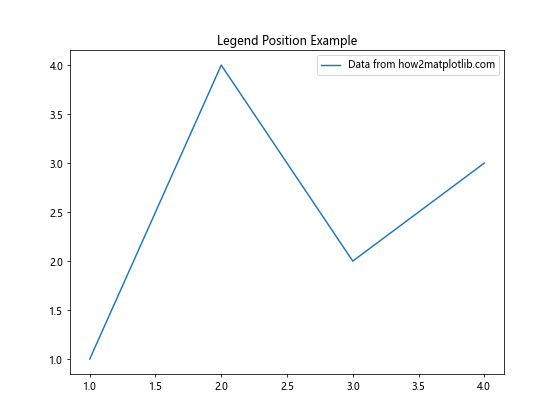
在这个例子中,我们使用 loc='upper right' 将图例放置在图表的右上角。常用的字符串位置包括:
- ‘best’
- ‘upper right’
- ‘upper left’
- ‘lower left’
- ‘lower right’
- ‘right’
- ‘center left’
- ‘center right’
- ‘lower center’
- ‘upper center’
- ‘center’
2.2 数字代码位置
除了字符串,Matplotlib 还支持使用数字代码来指定图例位置。每个数字对应一个特定的位置:
import matplotlib.pyplot as plt

plt.figure(figsize=(8, 6))
plt.plot([1, 2, 3, 4], [1, 4, 2, 3], label='Data from how2matplotlib.com')
plt.title('Legend Position with Numeric Code')
plt.legend(loc=1)  # 1 corresponds to 'upper right'
plt.show()
Output:
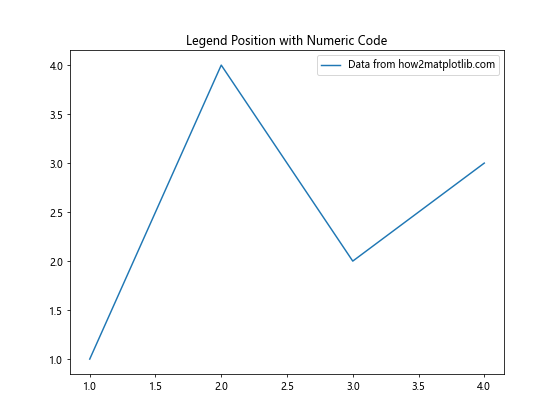
数字代码与位置的对应关系如下:
- 0: ‘best’
- 1: ‘upper right’
- 2: ‘upper left’
- 3: ‘lower left’
- 4: ‘lower right’
- 5: ‘right’
- 6: ‘center left’
- 7: ‘center right’
- 8: ‘lower center’
- 9: ‘upper center’
- 10: ‘center’
2.3 ‘best’ 位置
当使用 loc='best' 或 loc=0 时,Matplotlib 会尝试找到一个最佳位置来放置图例,以避免遮挡重要的数据点:
import matplotlib.pyplot as plt
import numpy as np

x = np.linspace(0, 10, 100)
plt.figure(figsize=(8, 6))
plt.plot(x, np.sin(x), label='sin(x) - how2matplotlib.com')
plt.plot(x, np.cos(x), label='cos(x) - how2matplotlib.com')
plt.title('Best Legend Position')
plt.legend(loc='best')
plt.show()
Output:
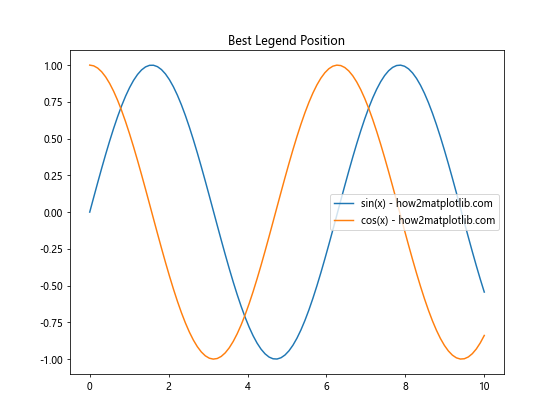
这个特性在处理复杂图表时特别有用,可以自动避免图例与数据重叠。
3. 自定义图例位置
除了使用预定义的位置,Matplotlib 还允许我们精确控制图例的位置。
3.1 使用坐标指定位置
我们可以使用 bbox_to_anchor 参数来精确指定图例的位置:
import matplotlib.pyplot as plt

plt.figure(figsize=(8, 6))
plt.plot([1, 2, 3, 4], [1, 4, 2, 3], label='Custom position - how2matplotlib.com')
plt.title('Custom Legend Position')
plt.legend(bbox_to_anchor=(0.5, 0.5), loc='center')
plt.show()
Output:
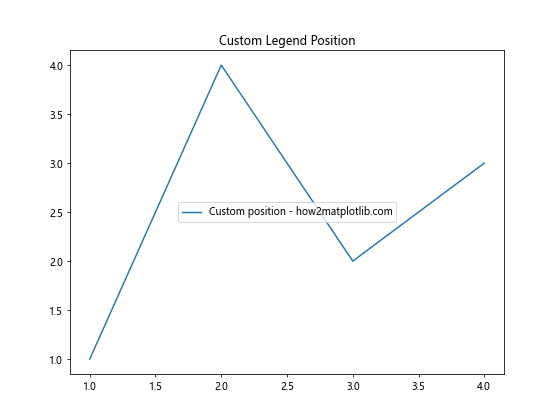
在这个例子中,bbox_to_anchor=(0.5, 0.5) 将图例放置在图表的中心位置。坐标系统使用的是轴的比例坐标,其中 (0, 0) 表示左下角,(1, 1) 表示右上角。
3.2 图例放置在图表外部
有时我们可能希望将图例放置在图表的外部。这可以通过调整 bbox_to_anchor 和 loc 参数来实现:
import matplotlib.pyplot as plt

plt.figure(figsize=(8, 6))
plt.plot([1, 2, 3, 4], [1, 4, 2, 3], label='Outside legend - how2matplotlib.com')
plt.title('Legend Outside the Plot')
plt.legend(bbox_to_anchor=(1.05, 1), loc='upper left')
plt.tight_layout()
plt.show()
Output:
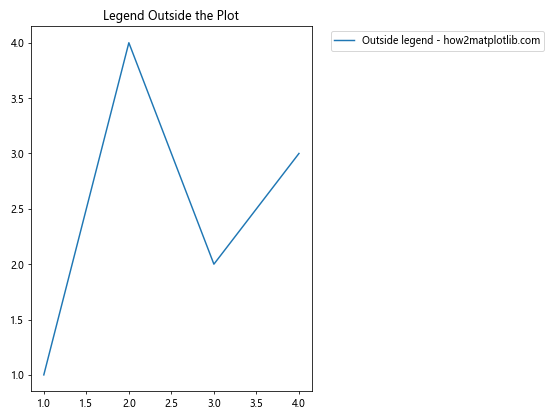
在这个例子中,图例被放置在图表的右侧。注意使用 plt.tight_layout() 来自动调整图表布局,以确保图例完全可见。
3.3 多列图例
对于包含多个数据系列的图表,我们可能希望将图例排列成多列:
import matplotlib.pyplot as plt
import numpy as np

x = np.linspace(0, 10, 100)
plt.figure(figsize=(10, 6))
plt.plot(x, np.sin(x), label='sin(x) - how2matplotlib.com')
plt.plot(x, np.cos(x), label='cos(x) - how2matplotlib.com')
plt.plot(x, np.tan(x), label='tan(x) - how2matplotlib.com')
plt.plot(x, np.exp(x), label='exp(x) - how2matplotlib.com')
plt.title('Multi-column Legend')
plt.legend(loc='upper center', bbox_to_anchor=(0.5, -0.05), ncol=2)
plt.tight_layout()
plt.show()
Output:
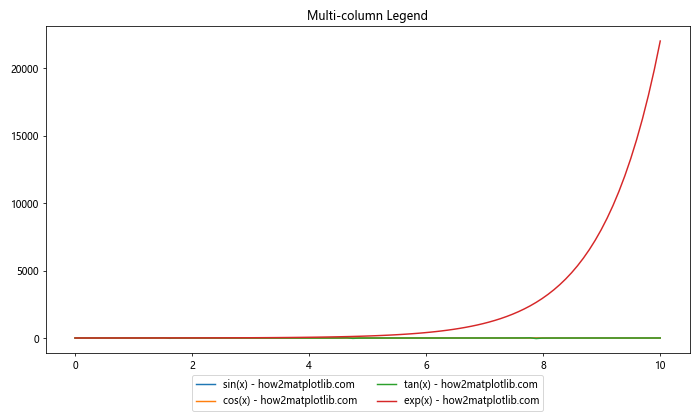
这个例子创建了一个两列的图例,位于图表的底部中心。ncol=2 参数指定了列数。
4. 图例样式调整
除了位置,我们还可以调整图例的各种样式属性来增强其可读性和美观性。
4.1 图例框样式
我们可以通过设置 fancybox、shadow 和 framealpha 等参数来调整图例框的样式:
import matplotlib.pyplot as plt

plt.figure(figsize=(8, 6))
plt.plot([1, 2, 3, 4], [1, 4, 2, 3], label='Fancy legend - how2matplotlib.com')
plt.title('Fancy Legend Style')
plt.legend(fancybox=True, shadow=True, framealpha=0.7)
plt.show()
Output:
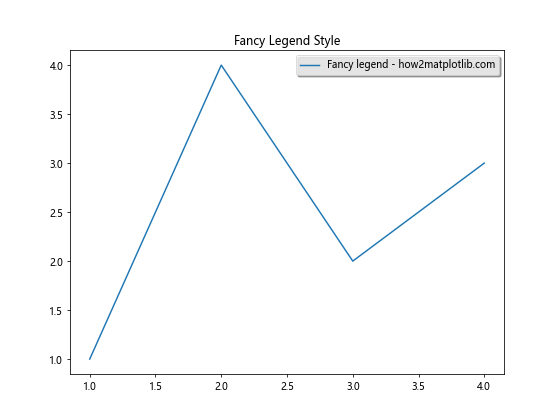
这个例子创建了一个带有圆角(fancybox=True)和阴影(shadow=True)的半透明(framealpha=0.7)图例框。
4.2 图例字体和颜色
我们可以自定义图例中文本的字体大小、样式和颜色:
import matplotlib.pyplot as plt

plt.figure(figsize=(8, 6))
plt.plot([1, 2, 3, 4], [1, 4, 2, 3], label='Custom font - how2matplotlib.com')
plt.title('Custom Legend Font')
plt.legend(prop={'family': 'serif', 'size': 14, 'weight': 'bold'},
           labelcolor='navy')
plt.show()
Output:
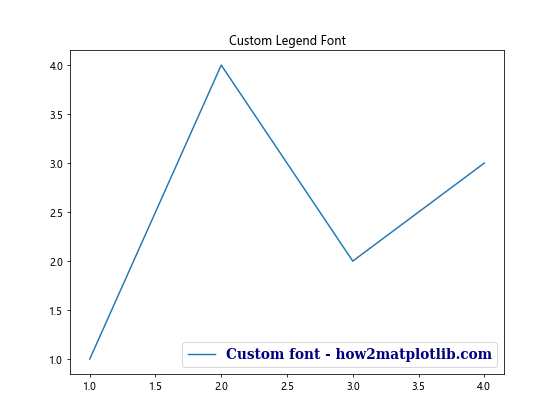
在这个例子中,我们使用 prop 参数设置字体属性,并使用 labelcolor 参数设置标签颜色。
4.3 图例标记大小
对于包含标记的图例,我们可能希望调整标记的大小:
import matplotlib.pyplot as plt

plt.figure(figsize=(8, 6))
plt.plot([1, 2, 3, 4], [1, 4, 2, 3], 'o-', label='Custom marker - how2matplotlib.com')
plt.title('Custom Legend Marker Size')
plt.legend(markerscale=2)  # Make the marker twice as big in the legend
plt.show()
Output:
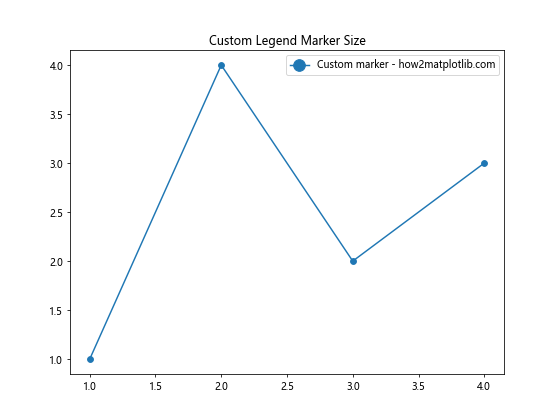
markerscale 参数允许我们相对于图表中的实际大小来缩放图例中的标记。
5. 高级图例技巧
接下来,我们将探讨一些更高级的图例使用技巧,这些技巧可以帮助你创建更复杂和信息丰富的图表。
5.1 多图例
有时,我们可能需要在一个图表中放置多个图例。这可以通过创建多个 Legend 对象来实现:
import matplotlib.pyplot as plt

fig, ax = plt.subplots(figsize=(8, 6))

line1, = ax.plot([1, 2, 3], [1, 2, 3], label='Line 1 - how2matplotlib.com')
line2, = ax.plot([1, 2, 3], [2, 3, 4], label='Line 2 - how2matplotlib.com')
line3, = ax.plot([1, 2, 3], [3, 4, 5], label='Line 3 - how2matplotlib.com')

first_legend = ax.legend(handles=[line1, line2], loc='upper left')
ax.add_artist(first_legend)
ax.legend(handles=[line3], loc='lower right')

plt.title('Multiple Legends')
plt.show()
Output:
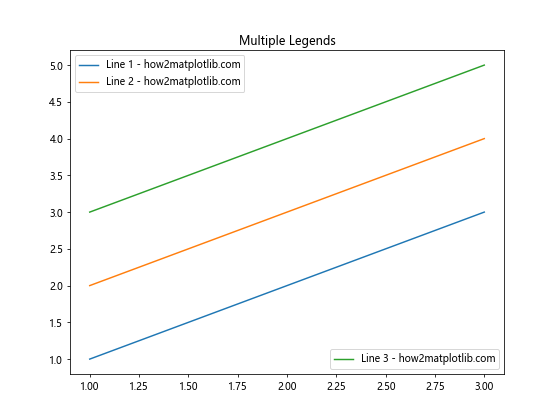
在这个例子中,我们创建了两个独立的图例,一个位于左上角,另一个位于右下角。
5.2 图例分组
对于包含多个相关数据系列的图表,我们可能希望将图例项分组:
import matplotlib.pyplot as plt
from matplotlib.legend_handler import HandlerLine2D, HandlerTuple

fig, ax = plt.subplots(figsize=(10, 6))

x = range(3)
y1 = [1, 2, 3]
y2 = [2, 3, 4]
y3 = [3, 4, 5]

l1, = ax.plot(x, y1, 'ro-')
l2, = ax.plot(x, y2, 'bo-')
l3, = ax.plot(x, y3, 'go-')

ax.legend([(l1, l2), l3], ['Group 1 - how2matplotlib.com', 'Line 3 - how2matplotlib.com'],
          handler_map={tuple: HandlerTuple(ndivide=None)})

plt.title('Grouped Legend')
plt.show()
Output:
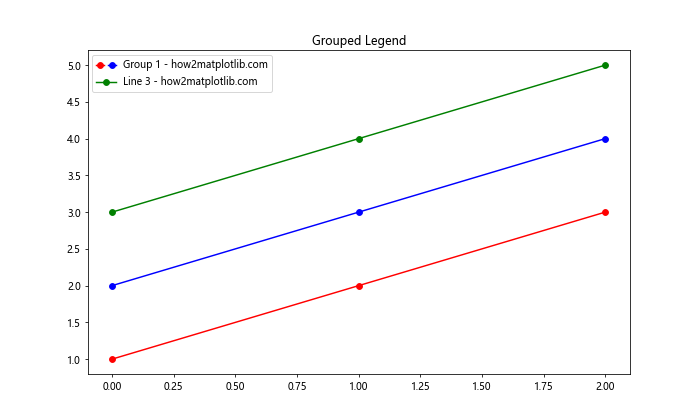
这个例子展示了如何将多条线组合成一个图例项。
5.3 自定义图例处理程序
Matplotlib 允许我们创建自定义的图例处理程序,以实现特殊的图例表示:
import matplotlib.pyplot as plt
import matplotlib.patches as mpatches

class MyHandler:
    def legend_artist(self, legend, orig_handle, fontsize, handlebox):
        x0, y0 = handlebox.xdescent, handlebox.ydescent
        width, height = handlebox.width, handlebox.height
        patch = mpatches.Rectangle([x0, y0], width, height, facecolor='red',
                                   edgecolor='black', hatch='xx', lw=3,
                                   transform=handlebox.get_transform())
        handlebox.add_artist(patch)
        return patch

plt.figure(figsize=(8, 6))
plt.plot([1, 2, 3], [1, 2, 3])
plt.title('Custom Legend Handler - how2matplotlib.com')
plt.legend([object()], ['My Custom Legend'],
           handler_map={object: MyHandler()})
plt.show()
Output:
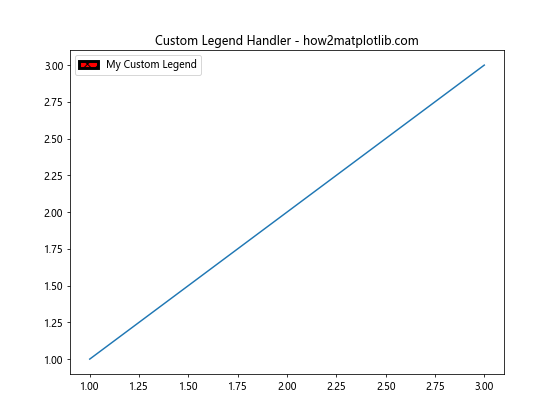
这个例子创建了一个自定义的图例处理程序,它绘制了一个带有交叉线的红色矩形。
6. 图例与子图
在使用子图时,图例的处理需要特别注意。以下是一些在子图中使用图例的技巧。
6.1 每个子图单独的图例
当使用子图时,我们通常希望每个子图都有自己的图例:
import matplotlib.pyplot as plt

fig, (ax1, ax2) = plt.subplots(1, 2, figsize=(12, 5))

ax1.plot([1, 2, 3], [1, 2, 3], label='Data 1 - how2matplotlib.com')
ax1ax1.legend()
ax1.set_title('Subplot 1')

ax2.plot([1, 2, 3], [3, 2, 1], label='Data 2 - how2matplotlib.com')
ax2.legend()
ax2.set_title('Subplot 2')

plt.tight_layout()
plt.show()
在这个例子中,我们为每个子图单独调用 legend() 方法,确保每个子图都有自己的图例。
6.2 共享图例
有时,我们可能希望为多个子图创建一个共享的图例:
import matplotlib.pyplot as plt

fig, (ax1, ax2) = plt.subplots(1, 2, figsize=(12, 5))

line1, = ax1.plot([1, 2, 3], [1, 2, 3], label='Data 1 - how2matplotlib.com')
ax1.set_title('Subplot 1')

line2, = ax2.plot([1, 2, 3], [3, 2, 1], label='Data 2 - how2matplotlib.com')
ax2.set_title('Subplot 2')

fig.legend(handles=[line1, line2], loc='lower center', ncol=2)
plt.tight_layout()
plt.show()
Output:
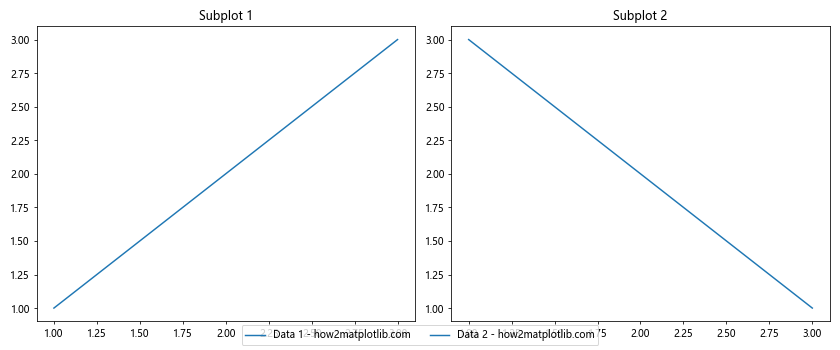
在这个例子中,我们使用 fig.legend() 创建了一个共享的图例,位于两个子图的下方。
6.3 图例位置在子图之间调整
当处理多个子图时,我们可能需要精细调整图例的位置以避免重叠:
import matplotlib.pyplot as plt

fig, (ax1, ax2) = plt.subplots(2, 1, figsize=(8, 10))

ax1.plot([1, 2, 3], [1, 2, 3], label='Upper plot - how2matplotlib.com')
ax1.set_title('Upper Subplot')

ax2.plot([1, 2, 3], [3, 2, 1], label='Lower plot - how2matplotlib.com')
ax2.set_title('Lower Subplot')

fig.legend(loc='center right', bbox_to_anchor=(1.1, 0.5))
plt.tight_layout()
plt.show()
Output:
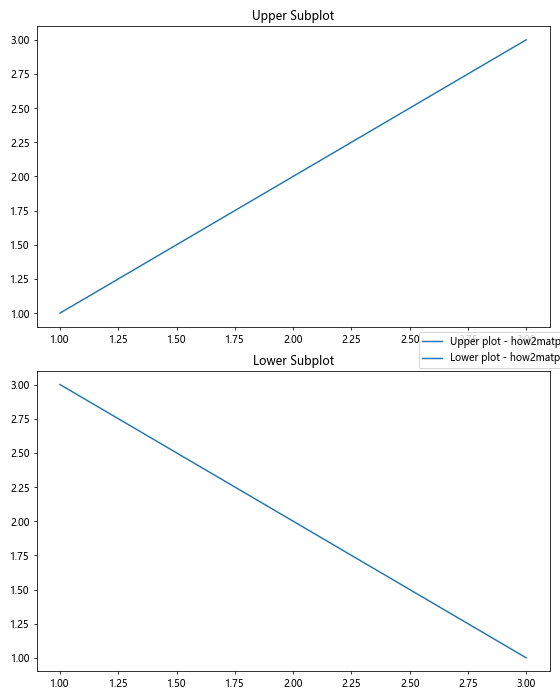
这个例子将共享图例放置在两个垂直排列的子图之间的右侧。
7. 图例与复杂图表元素
在创建复杂的图表时,图例的处理可能需要更多的技巧。
7.1 图例与误差线
当图表包含误差线时,我们可能希望在图例中也显示误差线:
import matplotlib.pyplot as plt
import numpy as np

x = np.linspace(0, 10, 50)
y = np.sin(x)
yerr = 0.1 + 0.2 * np.random.rand(len(x))

plt.figure(figsize=(10, 6))
plt.errorbar(x, y, yerr, label='Data with error - how2matplotlib.com',
             capsize=5, capthick=2)
plt.title('Error Bar Plot with Legend')
plt.legend()
plt.show()
Output:
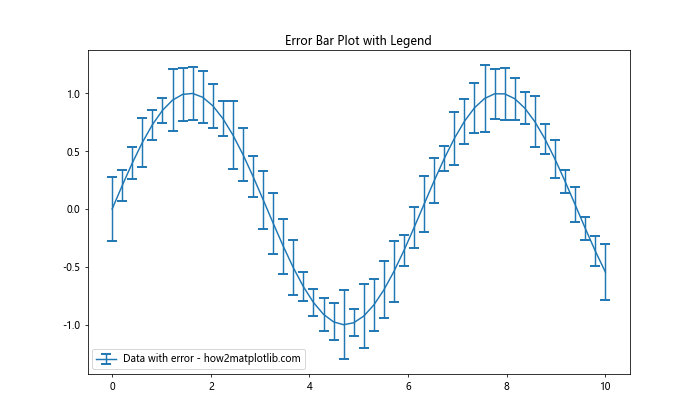
在这个例子中,误差线会自动包含在图例中。
7.2 图例与填充区域
对于包含填充区域的图表,我们可能希望在图例中表示这些填充区域:
import matplotlib.pyplot as plt
import numpy as np

x = np.linspace(0, 10, 100)
y1 = np.sin(x)
y2 = np.sin(x) + 0.5

plt.figure(figsize=(10, 6))
plt.plot(x, y1, label='Lower bound - how2matplotlib.com')
plt.plot(x, y2, label='Upper bound - how2matplotlib.com')
plt.fill_between(x, y1, y2, alpha=0.3, label='Filled region - how2matplotlib.com')
plt.title('Plot with Filled Region and Legend')
plt.legend()
plt.show()
Output:
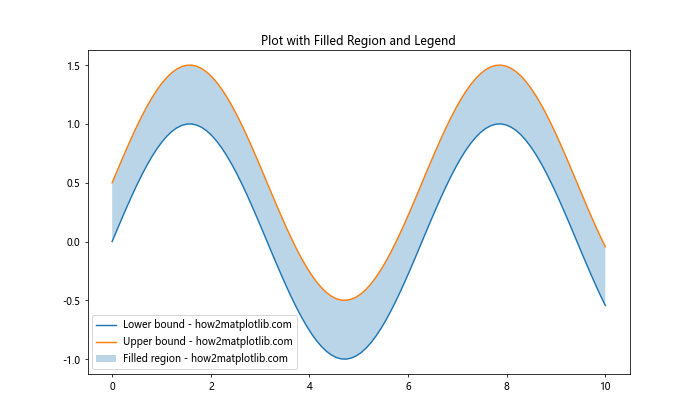
这个例子展示了如何在图例中包含填充区域。
7.3 图例与散点图
对于散点图,我们可能希望在图例中显示不同的标记:
import matplotlib.pyplot as plt
import numpy as np

np.random.seed(42)
data1 = np.random.rand(20, 2)
data2 = np.random.rand(20, 2) + 1

plt.figure(figsize=(10, 6))
plt.scatter(data1[:, 0], data1[:, 1], c='red', marker='o',
            label='Class 1 - how2matplotlib.com')
plt.scatter(data2[:, 0], data2[:, 1], c='blue', marker='^',
            label='Class 2 - how2matplotlib.com')
plt.title('Scatter Plot with Legend')
plt.legend()
plt.show()
Output:
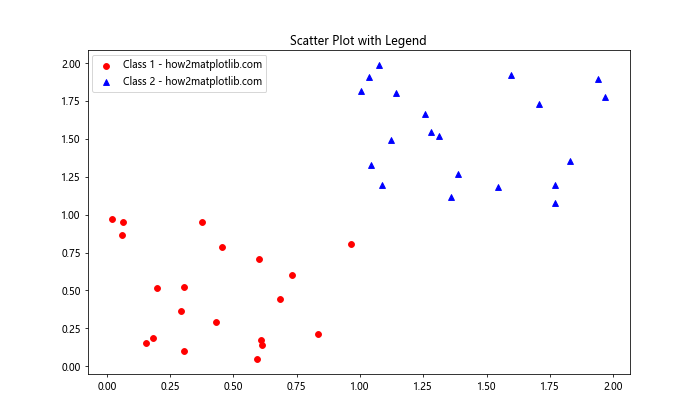
这个例子展示了如何为散点图创建包含不同标记的图例。
8. 图例的交互性
Matplotlib 还提供了一些交互性功能,可以增强图例的使用体验。
8.1 可拖动的图例
我们可以创建可以通过鼠标拖动的图例:
import matplotlib.pyplot as plt

plt.figure(figsize=(8, 6))
plt.plot([1, 2, 3, 4], [1, 4, 2, 3], label='Draggable legend - how2matplotlib.com')
plt.title('Draggable Legend')
legend = plt.legend(draggable=True)
plt.show()
Output:
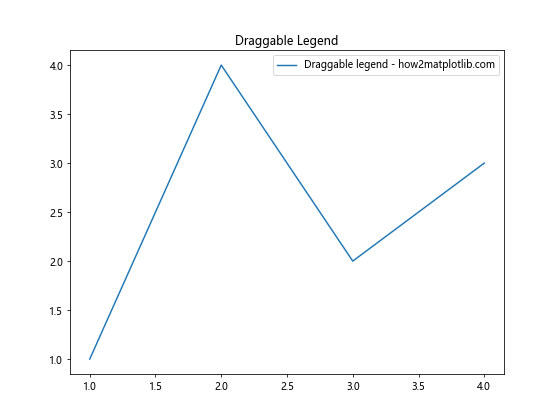
在这个例子中,用户可以通过鼠标拖动图例到图表的任何位置。
8.2 可点击的图例
我们可以创建可点击的图例,点击图例项可以切换对应数据系列的可见性:
import matplotlib.pyplot as plt

fig, ax = plt.subplots(figsize=(8, 6))

line1, = ax.plot([1, 2, 3], [1, 2, 3], label='Line 1 - how2matplotlib.com')
line2, = ax.plot([1, 2, 3], [3, 2, 1], label='Line 2 - how2matplotlib.com')

leg = ax.legend()

lined = {}  # Will map legend lines to original lines
for legline, origline in zip(leg.get_lines(), [line1, line2]):
    legline.set_picker(True)  # Enable picking on the legend line
    lined[legline] = origline

def on_pick(event):
    legline = event.artist
    origline = lined[legline]
    visible = not origline.get_visible()
    origline.set_visible(visible)
    legline.set_alpha(1.0 if visible else 0.2)
    fig.canvas.draw()

fig.canvas.mpl_connect('pick_event', on_pick)

plt.title('Clickable Legend')
plt.show()
Output:
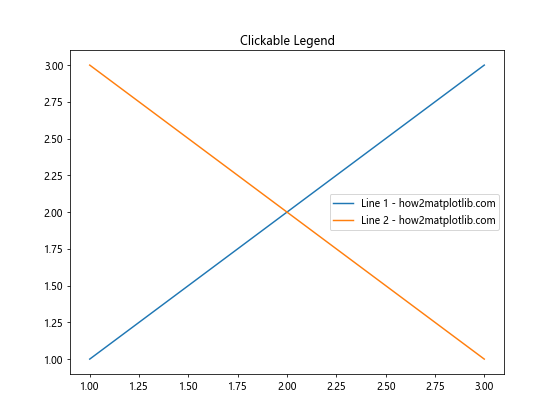
这个例子创建了一个可点击的图例,用户可以通过点击图例项来切换对应线条的可见性。
9. 图例的保存和导出
在创建完美的图例后,我们可能需要保存或导出图表。
9.1 保存带有图例的图表
保存带有图例的图表时,我们需要确保图例完全可见:
import matplotlib.pyplot as plt

plt.figure(figsize=(8, 6))
plt.plot([1, 2, 3, 4], [1, 4, 2, 3], label='Data - how2matplotlib.com')
plt.title('Saving Plot with Legend')
plt.legend(bbox_to_anchor=(1.05, 1), loc='upper left')
plt.tight_layout()
plt.savefig('plot_with_legend.png', dpi=300, bbox_inches='tight')
plt.close()
在这个例子中,我们使用 bbox_inches='tight' 参数确保图例完全包含在保存的图像中。
9.2 导出图例为单独的图像
有时我们可能需要将图例导出为单独的图像:
import matplotlib.pyplot as plt

fig, ax = plt.subplots(figsize=(8, 6))
ax.plot([1, 2, 3], [1, 2, 3], label='Line 1 - how2matplotlib.com')
ax.plot([1, 2, 3], [3, 2, 1], label='Line 2 - how2matplotlib.com')

legend = ax.legend()
fig.canvas.draw()
bbox = legend.get_window_extent().transformed(fig.dpi_scale_trans.inverted())
fig.savefig('legend.png', dpi=300, bbox_inches=bbox)
plt.close(fig)
这个例子展示了如何将图例保存为单独的图像文件。
10. 总结
通过本文的详细介绍,我们深入探讨了 Matplotlib 中图例位置设置的各个方面。从基本的内置位置设置,到精确的自定义位置控制,再到高级的样式调整和交互性功能,我们涵盖了广泛的技巧和方法。
掌握这些技巧将使你能够创建更加专业和信息丰富的数据可视化。记住,图例不仅仅是标识数据系列的工具,它还是提升图表整体设计和可读性的关键元素。通过合理设置图例的位置和样式,你可以确保你的图表既美观又易于理解。
在实际应用中,选择合适的图例位置和样式往往需要根据具体的数据和图表类型来决定。不断实践和尝试不同的设置,将帮助你找到最适合你的数据和受众的图例呈现方式。
最后,随着 Matplotlib 的不断发展,可能会有新的图例相关功能推出。保持关注 Matplotlib 的更新,并经常查阅官方文档,将有助于你始终掌握最新的图例控制技巧。
 极客教程
极客教程