Matplotlib中的Axis.set_animated()函数:提升动画效率的关键
参考:Matplotlib.axis.Axis.set_animated() function in Python
Matplotlib是Python中最流行的数据可视化库之一,它提供了丰富的绘图功能和灵活的定制选项。在创建动态图表和动画时,性能优化变得尤为重要。本文将深入探讨Matplotlib中的Axis.set_animated()函数,这是一个强大的工具,可以显著提高动画的效率和流畅度。
1. Axis.set_animated()函数简介
Axis.set_animated()是Matplotlib库中axis.Axis类的一个方法。这个函数的主要作用是设置轴(axis)对象的动画状态。当一个对象被标记为”animated”时,Matplotlib会对其进行特殊处理,以优化动画性能。
函数签名如下:
Axis.set_animated(b)
其中,b是一个布尔值,用于指定是否将轴对象设置为动画状态。
让我们通过一个简单的例子来了解这个函数的基本用法:
import matplotlib.pyplot as plt

fig, ax = plt.subplots()
ax.plot([1, 2, 3, 4], [1, 4, 2, 3], label='Data from how2matplotlib.com')
ax.set_title('Example Plot')

# 设置x轴为动画状态
ax.xaxis.set_animated(True)

plt.show()
Output:
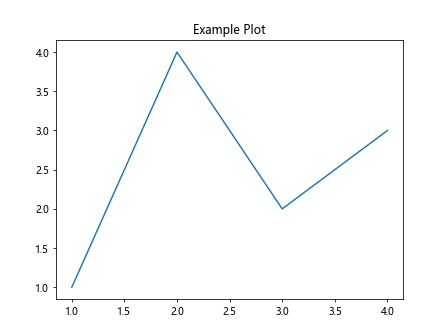
在这个例子中,我们创建了一个简单的折线图,并将x轴设置为动画状态。虽然在静态图中看不出明显差异,但这个设置在创建动画时会发挥重要作用。
2. 动画状态的工作原理
当一个对象被设置为动画状态时,Matplotlib会采用一种称为”blitting”的技术来优化渲染过程。Blitting是一种图形编程技术,它通过只更新发生变化的部分来提高动画效率,而不是重新绘制整个图形。
这种优化特别适用于以下场景:
- 图形的大部分内容保持不变
- 只有少量元素需要频繁更新
通过使用set_animated(True),我们告诉Matplotlib这个对象可能会频繁变化,应该使用blitting技术来优化其渲染。
让我们看一个稍微复杂一点的例子,展示如何在动画中使用这个函数:
import matplotlib.pyplot as plt
import matplotlib.animation as animation
import numpy as np

fig, ax = plt.subplots()
x = np.linspace(0, 2*np.pi, 100)
line, = ax.plot(x, np.sin(x))

# 设置线条为动画状态
line.set_animated(True)

def update(frame):
    line.set_ydata(np.sin(x + frame/10))
    return line,

ani = animation.FuncAnimation(fig, update, frames=200, interval=50, blit=True)
ax.set_title('Animated Sine Wave - how2matplotlib.com')
plt.show()
Output:
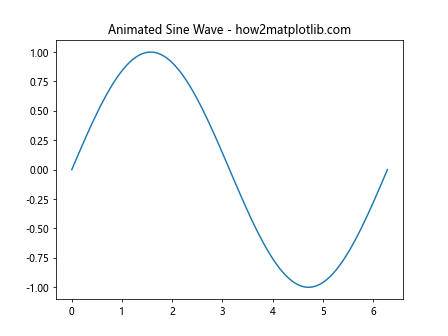
在这个例子中,我们创建了一个正弦波动画。通过将线条对象设置为动画状态,并在FuncAnimation中启用blitting(blit=True),我们可以显著提高动画的性能。
3. 何时使用set_animated()
虽然set_animated()可以提高动画效率,但并不是所有情况下都需要使用它。以下是一些适合使用这个函数的场景:
- 创建复杂的动画,其中大部分元素保持静态
- 需要高帧率的流畅动画
- 处理大量数据点的实时更新
让我们通过一个例子来说明何时使用set_animated()会带来明显的性能提升:
import matplotlib.pyplot as plt
import matplotlib.animation as animation
import numpy as np

fig, (ax1, ax2) = plt.subplots(2, 1, figsize=(8, 8))
x = np.linspace(0, 10, 1000)
line1, = ax1.plot(x, np.sin(x))
line2, = ax2.plot(x, np.cos(x))

# 只将line2设置为动画状态
line2.set_animated(True)

def update(frame):
    line1.set_ydata(np.sin(x + frame/10))
    line2.set_ydata(np.cos(x + frame/10))
    return line1, line2

ani = animation.FuncAnimation(fig, update, frames=200, interval=50, blit=True)
fig.suptitle('Animated Sine and Cosine - how2matplotlib.com')
plt.show()
Output:
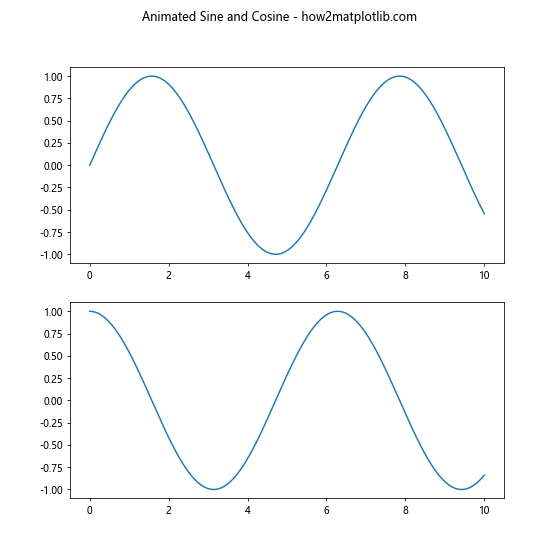
在这个例子中,我们创建了两个子图,分别显示正弦波和余弦波。我们只将余弦波(line2)设置为动画状态。这样做的效果是,在动画过程中,Matplotlib会对余弦波使用blitting优化,而正弦波则会完全重绘。在实际应用中,这种差异可能会导致性能的显著提升,特别是在处理大量数据点或复杂图形时。
4. set_animated()与其他动画相关函数的配合使用
为了充分发挥set_animated()的作用,通常需要将其与其他动画相关的函数和技术配合使用。以下是一些常见的组合:
4.1 与FuncAnimation配合
matplotlib.animation.FuncAnimation是创建动画的主要工具。当使用set_animated()时,确保在FuncAnimation中设置blit=True以启用blitting优化:
import matplotlib.pyplot as plt
import matplotlib.animation as animation
import numpy as np

fig, ax = plt.subplots()
x = np.linspace(0, 2*np.pi, 100)
line, = ax.plot(x, np.sin(x))

line.set_animated(True)
ax.set_title('Animated Sine Wave - how2matplotlib.com')

def update(frame):
    line.set_ydata(np.sin(x + frame/10))
    return line,

ani = animation.FuncAnimation(fig, update, frames=200, interval=50, blit=True)
plt.show()
Output:
4.2 与draw_artist()配合
在某些情况下,你可能需要更精细地控制绘图过程。draw_artist()函数允许你手动重绘特定的艺术家对象(如线条、文本等):
import matplotlib.pyplot as plt
import numpy as np

fig, ax = plt.subplots()
x = np.linspace(0, 2*np.pi, 100)
line, = ax.plot(x, np.sin(x))

line.set_animated(True)
fig.canvas.draw()
plt.title('Manual Animation - how2matplotlib.com')

background = fig.canvas.copy_from_bbox(ax.bbox)

for i in range(100):
    fig.canvas.restore_region(background)
    line.set_ydata(np.sin(x + i/10))
    ax.draw_artist(line)
    fig.canvas.blit(ax.bbox)
    plt.pause(0.05)

plt.show()
Output:
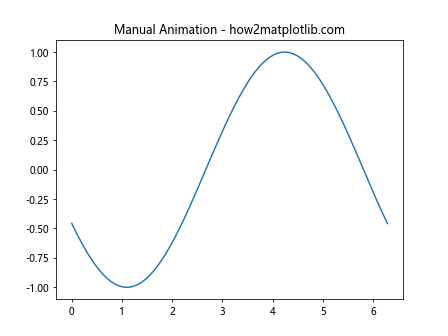
在这个例子中,我们手动实现了动画循环,使用draw_artist()来更新线条,并使用blit()来刷新显示。
5. set_animated()的性能影响
使用set_animated()可以显著提高动画的性能,特别是在处理复杂图形或大量数据点时。然而,重要的是要理解这种优化的工作原理和潜在的权衡。
5.1 性能提升
在大多数情况下,使用set_animated()会带来以下性能提升:
- 减少CPU使用率
- 提高动画帧率
- 降低内存使用
让我们通过一个例子来说明这种性能提升:
import matplotlib.pyplot as plt
import matplotlib.animation as animation
import numpy as np
import time

fig, (ax1, ax2) = plt.subplots(2, 1, figsize=(8, 8))
x = np.linspace(0, 10, 1000)
line1, = ax1.plot(x, np.sin(x))
line2, = ax2.plot(x, np.cos(x))

line2.set_animated(True)

def update(frame):
    line1.set_ydata(np.sin(x + frame/10))
    line2.set_ydata(np.cos(x + frame/10))
    return line1, line2

start_time = time.time()
ani = animation.FuncAnimation(fig, update, frames=200, interval=50, blit=True)
fig.suptitle('Performance Comparison - how2matplotlib.com')
plt.show()
end_time = time.time()

print(f"Animation duration: {end_time - start_time:.2f} seconds")
在这个例子中,我们可以比较设置和不设置set_animated()的性能差异。虽然在简单的例子中可能看不出明显区别,但在更复杂的场景中,性能差异会更加显著。
5.2 潜在的权衡
尽管set_animated()通常会提高性能,但也存在一些潜在的权衡:
- 初始化时间可能会略有增加
- 内存使用可能会略有增加(因为需要存储背景)
- 在某些特殊情况下,过度使用可能会导致视觉伪影
6. 高级应用:自定义动画
除了基本用法外,set_animated()还可以用于创建更复杂和自定义的动画效果。以下是一些高级应用的例子:
6.1 多对象动画
在复杂的动画中,你可能需要同时更新多个对象。这时,正确使用set_animated()变得尤为重要:
import matplotlib.pyplot as plt
import matplotlib.animation as animation
import numpy as np

fig, ax = plt.subplots()
x = np.linspace(0, 2*np.pi, 100)
line1, = ax.plot(x, np.sin(x), label='Sine')
line2, = ax.plot(x, np.cos(x), label='Cosine')
point, = ax.plot([], [], 'ro')

line1.set_animated(True)
line2.set_animated(True)
point.set_animated(True)

ax.legend()
ax.set_title('Multi-object Animation - how2matplotlib.com')

def update(frame):
    line1.set_ydata(np.sin(x + frame/10))
    line2.set_ydata(np.cos(x + frame/10))
    point.set_data(frame/10, np.sin(frame/10))
    return line1, line2, point

ani = animation.FuncAnimation(fig, update, frames=np.linspace(0, 2*np.pi, 128),
                              interval=50, blit=True)
plt.show()
Output:
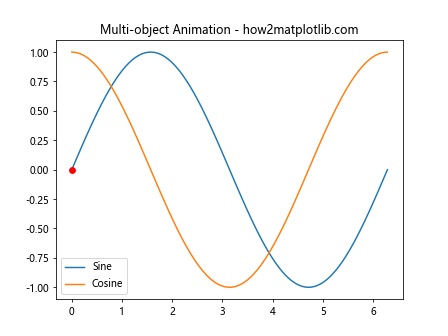
在这个例子中,我们同时动画化了两条线和一个点,所有这些对象都被设置为动画状态以优化性能。
6.2 动态添加和删除对象
有时,你可能需要在动画过程中动态添加或删除对象。这种情况下,正确管理动画状态变得更加重要:
import matplotlib.pyplot as plt
import matplotlib.animation as animation
import numpy as np

fig, ax = plt.subplots()
x = np.linspace(0, 2*np.pi, 100)
line, = ax.plot(x, np.sin(x))
points = []

line.set_animated(True)
ax.set_title('Dynamic Object Addition - how2matplotlib.com')

def update(frame):
    line.set_ydata(np.sin(x + frame/10))
    if frame % 20 == 0 and len(points) < 5:
        point, = ax.plot(frame/10, np.sin(frame/10), 'ro')
        point.set_animated(True)
        points.append(point)
    return [line] + points

ani = animation.FuncAnimation(fig, update, frames=200, interval=50, blit=True)
plt.show()
Output:
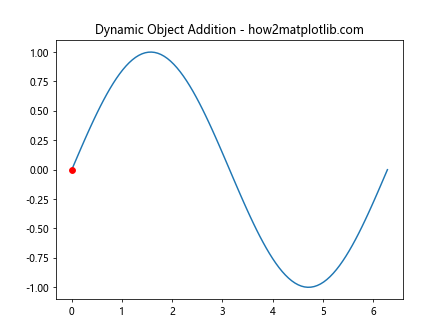
在这个例子中,我们在动画过程中动态添加点。每个新添加的点都被设置为动画状态,以确保整体性能不受影响。
7. 常见问题和解决方案
使用set_animated()时可能会遇到一些常见问题。以下是一些问题及其解决方案:
7.1 动画不流畅
如果动画看起来不流畅,可能是因为没有正确使用set_animated()或没有启用blitting。确保:
- 所有需要动画的对象都调用了
set_animated(True) - 在
FuncAnimation中设置了blit=True
import matplotlib.pyplot as plt
import matplotlib.animation as animation
import numpy as np

fig, ax = plt.subplots()
x = np.linspace(0, 2*np.pi, 100)
line, = ax.plot(x, np.sin(x))

line.set_animated(True)  # 确保设置为动画状态
ax.set_title('Smooth Animation - how2matplotlib.com')

def update(frame):
    line.set_ydata(np.sin(x + frame/10))
    return line,

# 确保设置blit=True
ani = animation.FuncAnimation(fig, update, frames=200, interval=50, blit=True)
plt.show()
Output:
7.2 部分对象不更新
如果某些对象在动画中没有更新,可能是因为它们没有被正确地返回给动画函数:
import matplotlib.pyplot as plt
import matplotlib.animation as animation
import numpy as np

fig, ax = plt.subplots()
x = np.linspace(0, 2*np.pi, 100)
line1, = ax.plot(x, np.sin(x),label='Sine')
line2, = ax.plot(x, np.cos(x), label='Cosine')

line1.set_animated(True)
line2.set_animated(True)
ax.legend()
ax.set_title('Updating Multiple Objects - how2matplotlib.com')

def update(frame):
    line1.set_ydata(np.sin(x + frame/10))
    line2.set_ydata(np.cos(x + frame/10))
    return line1, line2  # 确保返回所有需要更新的对象

ani = animation.FuncAnimation(fig, update, frames=200, interval=50, blit=True)
plt.show()
Output:
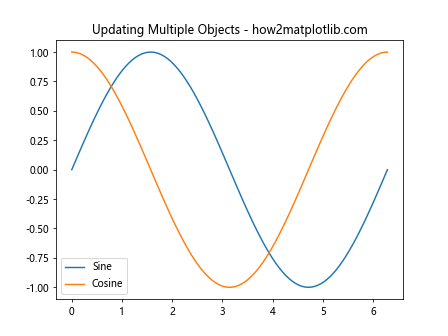
在这个例子中,我们确保在update函数中返回了所有需要更新的对象。
7.3 内存使用过高
如果发现内存使用过高,可能是因为创建了太多动画对象或没有正确清理。可以尝试以下方法:
import matplotlib.pyplot as plt
import matplotlib.animation as animation
import numpy as np

fig, ax = plt.subplots()
x = np.linspace(0, 2*np.pi, 100)
line, = ax.plot(x, np.sin(x))

line.set_animated(True)
ax.set_title('Memory Efficient Animation - how2matplotlib.com')

def update(frame):
    line.set_ydata(np.sin(x + frame/10))
    return line,

ani = animation.FuncAnimation(fig, update, frames=200, interval=50, blit=True)

# 显示动画
plt.show()

# 清理动画对象
ani._stop()
del ani
Output:
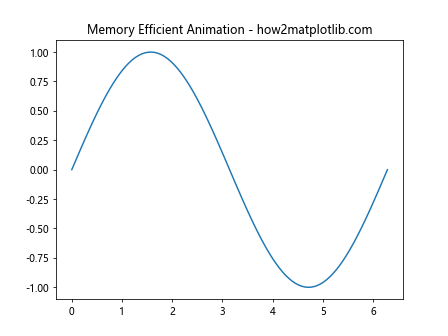
在这个例子中,我们在显示完动画后显式地停止和删除动画对象,以帮助释放内存。
8. set_animated()在不同Matplotlib后端中的表现
Matplotlib支持多种后端,每种后端在处理动画时可能有细微的差异。以下是set_animated()在几个常用后端中的表现:
8.1 TkAgg后端
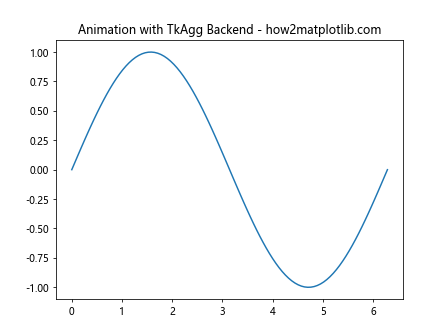
TkAgg是Matplotlib的默认后端之一,通常在使用set_animated()时表现良好:
import matplotlib
matplotlib.use('TkAgg')
import matplotlib.pyplot as plt
import matplotlib.animation as animation
import numpy as np

fig, ax = plt.subplots()
x = np.linspace(0, 2*np.pi, 100)
line, = ax.plot(x, np.sin(x))

line.set_animated(True)
ax.set_title('Animation with TkAgg Backend - how2matplotlib.com')

def update(frame):
    line.set_ydata(np.sin(x + frame/10))
    return line,

ani = animation.FuncAnimation(fig, update, frames=200, interval=50, blit=True)
plt.show()
Output:
8.2 Qt5Agg后端
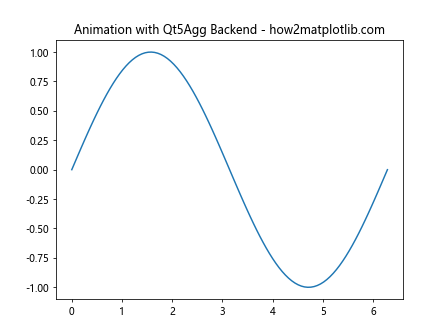
Qt5Agg后端通常在处理复杂动画时表现更好:
import matplotlib
matplotlib.use('Qt5Agg')
import matplotlib.pyplot as plt
import matplotlib.animation as animation
import numpy as np

fig, ax = plt.subplots()
x = np.linspace(0, 2*np.pi, 100)
line, = ax.plot(x, np.sin(x))

line.set_animated(True)
ax.set_title('Animation with Qt5Agg Backend - how2matplotlib.com')

def update(frame):
    line.set_ydata(np.sin(x + frame/10))
    return line,

ani = animation.FuncAnimation(fig, update, frames=200, interval=50, blit=True)
plt.show()
Output:
8.3 Notebook后端
在Jupyter Notebook中使用动画时,需要特别注意:
import matplotlib.pyplot as plt
import matplotlib.animation as animation
import numpy as np
from IPython.display import HTML

fig, ax = plt.subplots()
x = np.linspace(0, 2*np.pi, 100)
line, = ax.plot(x, np.sin(x))

line.set_animated(True)
ax.set_title('Animation in Jupyter Notebook - how2matplotlib.com')

def update(frame):
    line.set_ydata(np.sin(x + frame/10))
    return line,

ani = animation.FuncAnimation(fig, update, frames=200, interval=50, blit=True)
HTML(ani.to_jshtml())
在Notebook中,我们需要使用to_jshtml()方法来正确显示动画。
9. set_animated()与其他Matplotlib功能的集成
set_animated()可以与Matplotlib的其他高级功能结合使用,以创建更复杂和有趣的可视化效果。
9.1 与交互式工具结合
例如,我们可以将动画与Matplotlib的交互式工具结合使用:
import matplotlib.pyplot as plt
import matplotlib.animation as animation
import numpy as np
from matplotlib.widgets import Slider

fig, ax = plt.subplots()
plt.subplots_adjust(bottom=0.2)
t = np.linspace(0, 2*np.pi, 200)
line, = ax.plot(t, np.sin(t))

line.set_animated(True)
ax.set_title('Interactive Animated Plot - how2matplotlib.com')

ax_freq = plt.axes([0.1, 0.05, 0.8, 0.03])
freq_slider = Slider(ax_freq, 'Freq', 0.1, 10.0, valinit=1)

def update(frame):
    freq = freq_slider.val
    line.set_ydata(np.sin(freq * (t + frame/10)))
    return line,

ani = animation.FuncAnimation(fig, update, frames=200, interval=50, blit=True)
plt.show()
Output:
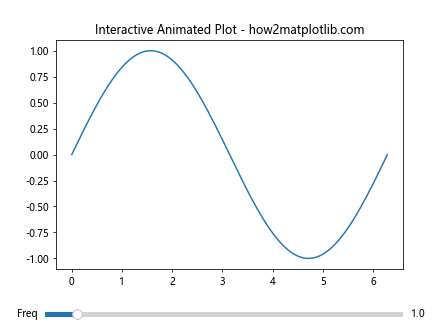
在这个例子中,我们添加了一个滑块来控制正弦波的频率,同时保持动画的流畅性。
9.2 与子图结合
set_animated()也可以在复杂的多子图布局中使用:
import matplotlib.pyplot as plt
import matplotlib.animation as animation
import numpy as np

fig, (ax1, ax2) = plt.subplots(2, 1, figsize=(8, 8))
t = np.linspace(0, 2*np.pi, 200)
line1, = ax1.plot(t, np.sin(t))
line2, = ax2.plot(t, np.cos(t))

line1.set_animated(True)
line2.set_animated(True)
ax1.set_title('Sine Wave - how2matplotlib.com')
ax2.set_title('Cosine Wave - how2matplotlib.com')

def update(frame):
    line1.set_ydata(np.sin(t + frame/10))
    line2.set_ydata(np.cos(t + frame/10))
    return line1, line2

ani = animation.FuncAnimation(fig, update, frames=200, interval=50, blit=True)
plt.tight_layout()
plt.show()
Output:
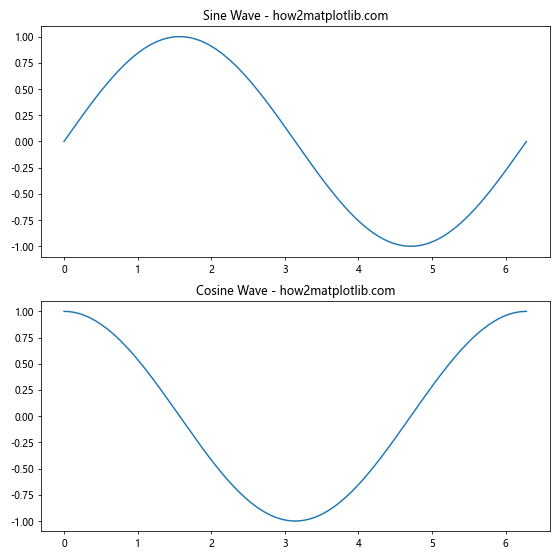
这个例子展示了如何在多个子图中同时使用动画,每个子图都有自己的动画对象。
10. 总结与最佳实践
在使用Matplotlib的Axis.set_animated()函数时,以下是一些最佳实践和总结:
- 只对需要频繁更新的对象使用
set_animated(True)。 - 在使用
FuncAnimation时,确保设置blit=True以获得最佳性能。 - 在
update函数中返回所有需要更新的对象。 - 对于复杂的动画,考虑使用手动动画循环和
draw_artist()方法。 - 在不同的后端中测试你的动画,以确保跨平台的一致性。
- 在处理大量数据或复杂图形时,使用
set_animated()可以显著提高性能。 - 结合其他Matplotlib功能,如交互式工具,可以创建更丰富的用户体验。
- 在完成动画后,记得清理动画对象以释放内存。
通过掌握set_animated()函数及其相关技术,你可以创建既高效又流畅的Matplotlib动画,为你的数据可视化项目增添生动的元素。无论是简单的数据更新还是复杂的交互式图表,正确使用这个函数都能帮助你实现理想的效果。
 极客教程
极客教程