Matplotlib中的axis.Axis.set_clip_box()函数详解与应用
参考:Matplotlib.axis.Axis.set_clip_box() function in Python
Matplotlib是Python中最流行的数据可视化库之一,它提供了丰富的绘图功能和自定义选项。在Matplotlib中,axis.Axis.set_clip_box()函数是一个非常有用的工具,用于控制坐标轴的裁剪区域。本文将深入探讨这个函数的用法、参数和应用场景,帮助读者更好地理解和使用这个功能。
1. set_clip_box()函数简介
set_clip_box()函数是Matplotlib库中axis.Axis类的一个方法。它的主要作用是设置坐标轴的裁剪区域,即定义坐标轴可见部分的边界。通过使用这个函数,我们可以控制坐标轴的显示范围,实现一些特殊的可视化效果。
函数的基本语法如下:
Axis.set_clip_box(clipbox)
其中,clipbox参数是一个matplotlib.transforms.Bbox对象,用于定义裁剪区域的边界框。
2. 创建Bbox对象
在使用set_clip_box()函数之前,我们需要先创建一个Bbox对象。Bbox(Bounding Box)是Matplotlib中用于表示矩形区域的类。我们可以通过以下几种方式创建Bbox对象:
2.1 使用from_bounds()方法
import matplotlib.pyplot as plt
from matplotlib.transforms import Bbox

fig, ax = plt.subplots()
bbox = Bbox.from_bounds(0.2, 0.2, 0.6, 0.6)
ax.text(0.5, 0.5, "how2matplotlib.com", ha='center', va='center')
ax.set_xlim(0, 1)
ax.set_ylim(0, 1)
ax.xaxis.set_clip_box(bbox)
ax.yaxis.set_clip_box(bbox)
plt.show()
Output:
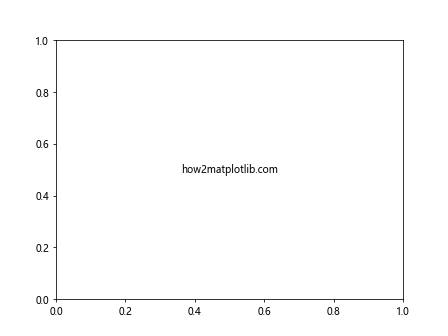
在这个例子中,我们使用Bbox.from_bounds()方法创建了一个Bbox对象。该方法接受四个参数:x坐标、y坐标、宽度和高度。这里我们创建了一个从(0.2, 0.2)开始,宽度为0.6,高度为0.6的矩形区域。
2.2 使用from_extents()方法
import matplotlib.pyplot as plt
from matplotlib.transforms import Bbox

fig, ax = plt.subplots()
bbox = Bbox.from_extents(0.1, 0.1, 0.9, 0.9)
ax.text(0.5, 0.5, "how2matplotlib.com", ha='center', va='center')
ax.set_xlim(0, 1)
ax.set_ylim(0, 1)
ax.xaxis.set_clip_box(bbox)
ax.yaxis.set_clip_box(bbox)
plt.show()
Output:
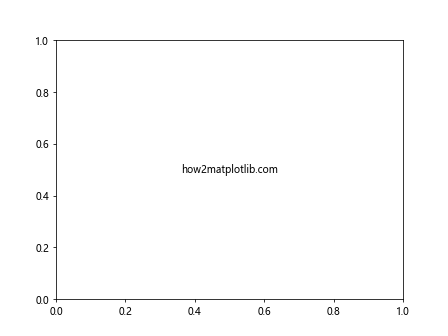
Bbox.from_extents()方法接受四个参数:左边界、下边界、右边界和上边界。在这个例子中,我们创建了一个从(0.1, 0.1)到(0.9, 0.9)的矩形区域。
3. 应用set_clip_box()函数
现在我们已经了解了如何创建Bbox对象,接下来让我们看看如何使用set_clip_box()函数来控制坐标轴的裁剪区域。
3.1 裁剪单个坐标轴
import matplotlib.pyplot as plt
from matplotlib.transforms import Bbox

fig, ax = plt.subplots()
bbox = Bbox.from_bounds(0.2, 0, 0.6, 1)
ax.plot([0, 1], [0, 1], label='how2matplotlib.com')
ax.set_xlim(0, 1)
ax.set_ylim(0, 1)
ax.xaxis.set_clip_box(bbox)
ax.legend()
plt.show()
Output:
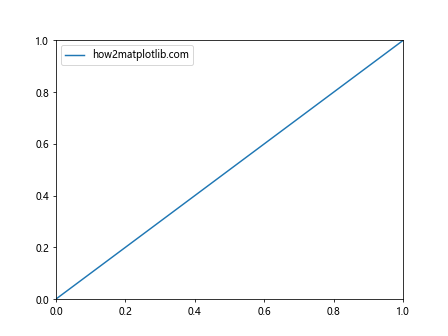
在这个例子中,我们只对x轴应用了裁剪。注意观察x轴的刻度标签,它们只在指定的裁剪区域内可见。
3.2 裁剪多个坐标轴
import matplotlib.pyplot as plt
from matplotlib.transforms import Bbox

fig, ax = plt.subplots()
bbox = Bbox.from_bounds(0.2, 0.2, 0.6, 0.6)
ax.plot([0, 1], [0, 1], label='how2matplotlib.com')
ax.set_xlim(0, 1)
ax.set_ylim(0, 1)
ax.xaxis.set_clip_box(bbox)
ax.yaxis.set_clip_box(bbox)
ax.legend()
plt.show()
Output:
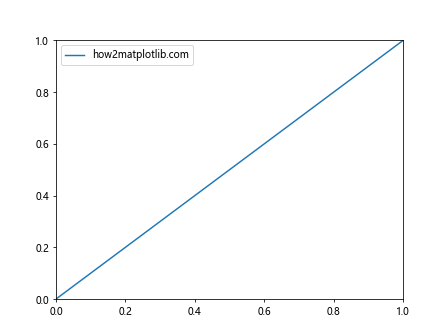
这个例子展示了如何同时对x轴和y轴应用裁剪。注意观察两个坐标轴的刻度标签,它们都只在指定的裁剪区域内可见。
4. 结合其他Matplotlib功能
set_clip_box()函数可以与Matplotlib的其他功能结合使用,创造出更加丰富的可视化效果。
4.1 结合子图使用
import matplotlib.pyplot as plt
from matplotlib.transforms import Bbox

fig, (ax1, ax2) = plt.subplots(1, 2, figsize=(10, 5))

bbox1 = Bbox.from_bounds(0.1, 0.1, 0.8, 0.8)
ax1.plot([0, 1], [0, 1], label='how2matplotlib.com')
ax1.set_xlim(0, 1)
ax1.set_ylim(0, 1)
ax1.xaxis.set_clip_box(bbox1)
ax1.yaxis.set_clip_box(bbox1)
ax1.set_title('Subplot 1')

bbox2 = Bbox.from_bounds(0.2, 0.2, 0.6, 0.6)
ax2.plot([0, 1], [0, 1], label='how2matplotlib.com')
ax2.set_xlim(0, 1)
ax2.set_ylim(0, 1)
ax2.xaxis.set_clip_box(bbox2)
ax2.yaxis.set_clip_box(bbox2)
ax2.set_title('Subplot 2')

plt.tight_layout()
plt.show()
Output:
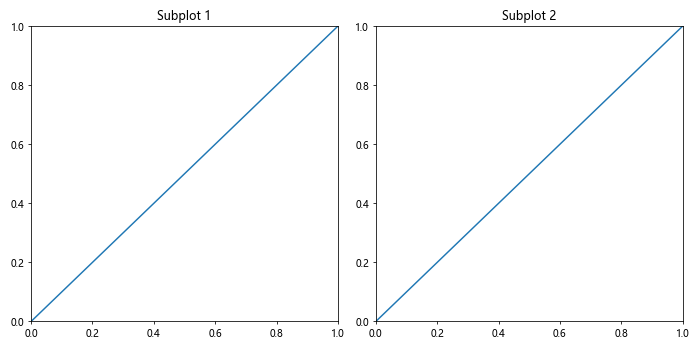
这个例子展示了如何在多个子图中分别应用不同的裁剪区域。
4.2 结合自定义样式
import matplotlib.pyplot as plt
from matplotlib.transforms import Bbox

plt.style.use('seaborn')

fig, ax = plt.subplots()
bbox = Bbox.from_bounds(0.1, 0.1, 0.8, 0.8)
ax.plot([0, 1], [0, 1], label='how2matplotlib.com', color='red', linewidth=2)
ax.set_xlim(0, 1)
ax.set_ylim(0, 1)
ax.xaxis.set_clip_box(bbox)
ax.yaxis.set_clip_box(bbox)
ax.set_title('Custom Style with Clipped Axes', fontsize=16)
ax.legend()
plt.show()
这个例子展示了如何结合自定义样式和set_clip_box()函数来创建更加美观的图表。
5. 高级应用
除了基本的用法,set_clip_box()函数还有一些高级应用,可以帮助我们创建更加复杂和有趣的可视化效果。
5.1 动态裁剪区域
import matplotlib.pyplot as plt
from matplotlib.transforms import Bbox
import numpy as np

fig, ax = plt.subplots()

x = np.linspace(0, 10, 100)
y = np.sin(x)

line, = ax.plot(x, y, label='how2matplotlib.com')
ax.set_xlim(0, 10)
ax.set_ylim(-1.5, 1.5)

for i in range(10):
    bbox = Bbox.from_bounds(i, -1.5, 1, 3)
    ax.xaxis.set_clip_box(bbox)
    ax.yaxis.set_clip_box(bbox)
    plt.pause(0.5)

plt.show()
Output:

这个例子展示了如何创建一个动态的裁剪区域。裁剪区域会随时间变化,创造出一种动画效果。
5.2 不规则裁剪区域
import matplotlib.pyplot as plt
from matplotlib.transforms import Bbox
from matplotlib.patches import Rectangle

fig, ax = plt.subplots()

# 创建一个不规则的裁剪区域
clip_path = Rectangle((0.2, 0.2), 0.6, 0.6, transform=ax.transAxes,
                      facecolor='none', edgecolor='red')
ax.add_patch(clip_path)

# 绘制数据
x = [0, 0.5, 1]
y = [0, 1, 0]
ax.plot(x, y, label='how2matplotlib.com')

# 设置裁剪区域
ax.set_clip_path(clip_path)

ax.set_xlim(0, 1)
ax.set_ylim(0, 1)
ax.legend()
plt.show()
Output:
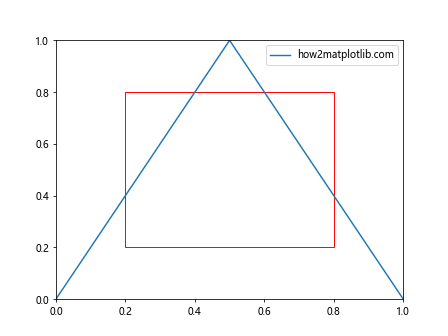
这个例子展示了如何创建一个不规则的裁剪区域。我们使用Rectangle对象创建了一个矩形裁剪区域,并将其应用到整个坐标轴上。
6. 注意事项和最佳实践
在使用set_clip_box()函数时,有一些注意事项和最佳实践需要牢记:
- 坐标系统:
Bbox对象使用的是图形坐标系统,范围通常是0到1。确保你的裁剪区域在这个范围内。 -
性能考虑:过度使用裁剪可能会影响绘图性能。只在必要时使用裁剪。
-
可读性:确保裁剪不会影响图表的可读性。避免裁剪掉重要的标签或数据点。
-
结合其他功能:
set_clip_box()可以与其他Matplotlib功能结合使用,如子图、样式设置等,以创建更复杂的可视化效果。 -
动态更新:在交互式环境中,你可以动态更新裁剪区域,创建动画效果。
7. 常见问题和解决方案
使用set_clip_box()函数时,可能会遇到一些常见问题。以下是一些问题及其解决方案:
7.1 裁剪区域不可见
import matplotlib.pyplot as plt
from matplotlib.transforms import Bbox

fig, ax = plt.subplots()
bbox = Bbox.from_bounds(0.2, 0.2, 0.6, 0.6)
ax.plot([0, 1], [0, 1], label='how2matplotlib.com')
ax.set_xlim(0, 1)
ax.set_ylim(0, 1)
ax.xaxis.set_clip_box(bbox)
ax.yaxis.set_clip_box(bbox)

# 添加这行代码来显示裁剪区域
ax.add_patch(plt.Rectangle((0.2, 0.2), 0.6, 0.6, fill=False, edgecolor='red'))

ax.legend()
plt.show()
Output:
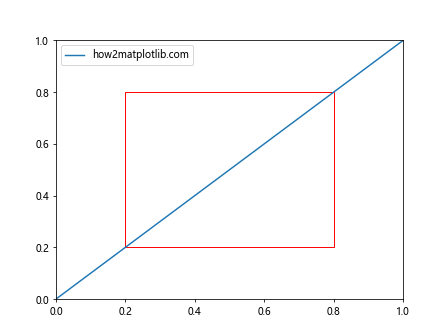
如果你想要可视化裁剪区域,可以添加一个矩形patch来表示裁剪区域的边界。
7.2 裁剪效果不明显
import matplotlib.pyplot as plt
from matplotlib.transforms import Bbox

fig, ax = plt.subplots()
bbox = Bbox.from_bounds(0.2, 0.2, 0.6, 0.6)
ax.plot([0, 1], [0, 1], label='how2matplotlib.com')
ax.set_xlim(0, 1)
ax.set_ylim(0, 1)
ax.xaxis.set_clip_box(bbox)
ax.yaxis.set_clip_box(bbox)

# 增加刻度密度
ax.xaxis.set_major_locator(plt.MultipleLocator(0.1))
ax.yaxis.set_major_locator(plt.MultipleLocator(0.1))

ax.legend()
plt.show()
Output:
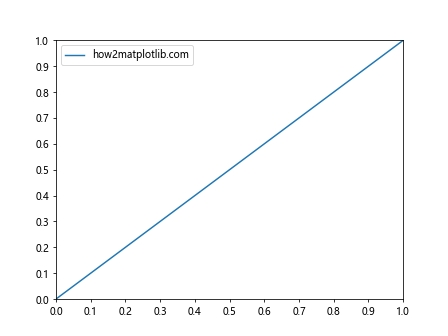
如果裁剪效果不明显,可以尝试增加坐标轴的刻度密度,这样裁剪效果会更加明显。
8. 高级技巧
除了基本用法,set_clip_box()函数还有一些高级技巧可以使用:
8.1 结合透明度
import matplotlib.pyplot as plt
from matplotlib.transforms import Bbox
import numpy as np

fig, ax = plt.subplots()

x = np.linspace(0, 10, 100)
y = np.sin(x)

line, = ax.plot(x, y, label='how2matplotlib.com', alpha=0.5)
ax.set_xlim(0, 10)
ax.set_ylim(-1.5, 1.5)

bbox = Bbox.from_bounds(2, -1, 6, 2)
ax.xaxis.set_clip_box(bbox)
ax.yaxis.set_clip_box(bbox)

# 添加一个完全不透明的区域
ax.add_patch(plt.Rectangle((2, -1), 6, 2, alpha=0.3, color='yellow'))

ax.legend()
plt.show()
Output:
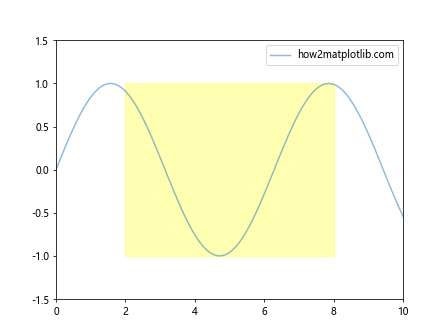
这个例子展示了如何结合透明度和裁剪区域来创建有趣的视觉效果。
8.2 多层裁剪
import matplotlib.pyplot as plt
from matplotlib.transforms import Bbox
import numpy as np

fig, ax = plt.subplots()

x = np.linspace(0, 10, 100)
y1 = np.sin(x)
y2 = np.cos(x)

line1, = ax.plot(x, y1, label='sin(x) - how2matplotlib.com', color='blue')
line2, = ax.plot(x, y2, label='cos(x) - how2matplotlib.com', color='red')
ax.set_xlim(0, 10)
ax.set_ylim(-1.5, 1.5)

bbox1 = Bbox.from_bounds(2, -1, 3, 2)
bbox2 = Bbox.from_bounds(5, -1, 3, 2)

line1.set_clip_box(bbox1)
line2.set_clip_box(bbox2)

ax.add_patch(plt.Rectangle((2, -1), 3, 2, alpha=0.1, color='blue'))
ax.add_patch(plt.Rectangle((5, -1), 3, 2, alpha=0.1, color='red'))

ax.legend()
plt.show()
Output:
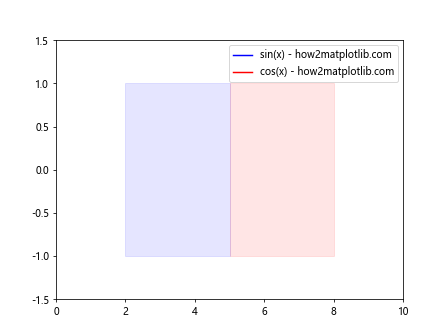
这个例子展示了如何对不同的图形元素应用不同的裁剪区域,创建多层裁剪效果。
9. 与其他Matplotlib功能的集成
set_clip_box()函数可以与Matplotlib的其他功能无缝集成,以创建更复杂和有趣的可视化效果。
9.1 结合极坐标系
import matplotlib.pyplot as plt
from matplotlib.transforms import Bbox
import numpy as np

fig, ax = plt.subplots(subplot_kw=dict(projection='polar'))

r = np.linspace(0, 1, 100)
theta = 2 * np.pi * r

ax.plot(theta, r, label='how2matplotlib.com')

bbox = Bbox.from_bounds(0.2, 0.2, 0.6, 0.6)
ax.xaxis.set_clip_box(bbox)
ax.yaxis.set_clip_box(bbox)

ax.set_ylim(0, 1)
ax.legend()
plt.show()
Output:
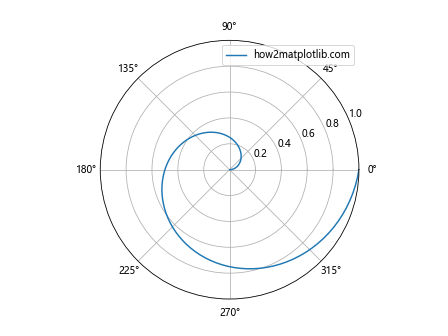
这个例子展示了如何在极坐标系中使用set_clip_box()函数。
9.2 3D图形中的应用
import matplotlib.pyplot as plt
from matplotlib.transforms import Bbox
import numpy as np

fig = plt.figure()
ax = fig.add_subplot(111, projection='3d')

x = np.linspace(-5, 5, 100)
y = np.linspace(-5, 5, 100)
X, Y = np.meshgrid(x, y)
Z = np.sin(np.sqrt(X**2 + Y**2))

surf = ax.plot_surface(X, Y, Z, cmap='viridis', label='how2matplotlib.com')

bbox = Bbox.from_bounds(0.2, 0.2, 0.6, 0.6)
ax.xaxis.set_clip_box(bbox)
ax.yaxis.set_clip_box(bbox)
ax.zaxis.set_clip_box(bbox)

ax.set_xlabel('X')
ax.set_ylabel('Y')
ax.set_zlabel('Z')
plt.show()
Output:
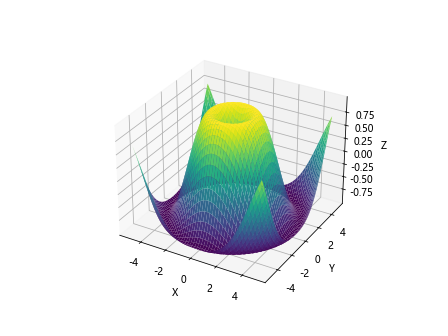
这个例子展示了如何在3D图形中应用set_clip_box()函数。
10. 性能优化
虽然set_clip_box()函数是一个强大的工具,但过度使用可能会影响绘图性能。以下是一些优化建议:
10.1 限制裁剪区域的数量
import matplotlib.pyplot as plt
from matplotlib.transforms import Bbox
import numpy as np

fig, ax = plt.subplots()

x = np.linspace(0, 10, 1000)
y = np.sin(x)

line, = ax.plot(x, y, label='how2matplotlib.com')
ax.set_xlim(0, 10)
ax.set_ylim(-1.5, 1.5)

# 使用单个大的裁剪区域而不是多个小的
bbox = Bbox.from_bounds(1, -1, 8, 2)
ax.set_clip_box(bbox)

ax.legend()
plt.show()
Output:
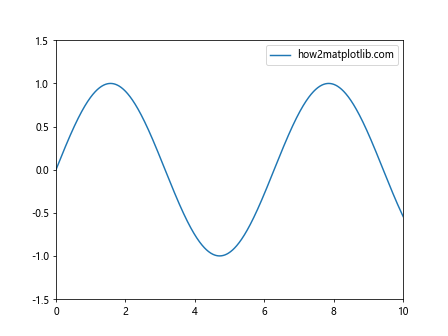
这个例子展示了如何使用单个大的裁剪区域来代替多个小的裁剪区域,从而提高性能。
10.2 使用clip_path代替clip_box
import matplotlib.pyplot as plt
from matplotlib.path import Path
import matplotlib.patches as patches

fig, ax = plt.subplots()

x = np.linspace(0, 10, 1000)
y = np.sin(x)

line, = ax.plot(x, y, label='how2matplotlib.com')
ax.set_xlim(0, 10)
ax.set_ylim(-1.5, 1.5)

# 使用clip_path代替clip_box
verts = [(2, -1), (8, -1), (8, 1), (2, 1), (2, -1)]
codes = [Path.MOVETO, Path.LINETO, Path.LINETO, Path.LINETO, Path.CLOSEPOLY]
clip_path = Path(verts, codes)
ax.set_clip_path(patches.PathPatch(clip_path, transform=ax.transData))

ax.legend()
plt.show()
这个例子展示了如何使用clip_path代替clip_box来实现更灵活的裁剪,同时可能提高性能。
11. 总结
axis.Axis.set_clip_box()函数是Matplotlib中一个强大而灵活的工具,它允许我们精确控制坐标轴的可见区域。通过本文的详细介绍和丰富的示例,我们了解了如何创建和应用裁剪区域,如何结合其他Matplotlib功能,以及如何处理常见问题和优化性能。
无论是创建简单的数据可视化还是复杂的科学图表,掌握set_clip_box()函数都能让我们的图表更加精确和美观。希望这篇文章能够帮助你更好地理解和使用这个函数,在数据可视化的道路上走得更远。
记住,数据可视化是一门艺术,而set_clip_box()函数就是你画笔中的一种。善用它,你就能创造出更加精彩的可视化作品。继续探索,继续创新,让你的数据讲述更加引人入胜的故事!
 极客教程
极客教程