Matplotlib中的axis.Axis.set_alpha()函数:轴透明度设置详解
参考:Matplotlib.axis.Axis.set_alpha() function in Python
Matplotlib是Python中最流行的数据可视化库之一,它提供了丰富的绘图功能和自定义选项。在Matplotlib中,axis.Axis.set_alpha()函数是一个非常有用的工具,用于设置坐标轴的透明度。本文将深入探讨这个函数的用法、参数和应用场景,帮助你更好地掌握Matplotlib中的透明度设置技巧。
1. axis.Axis.set_alpha()函数简介
axis.Axis.set_alpha()函数是Matplotlib库中Axis对象的一个方法,用于设置坐标轴及其相关元素(如刻度线、刻度标签等)的透明度。透明度值范围从0(完全透明)到1(完全不透明)。
这个函数的基本语法如下:
axis.set_alpha(alpha)
其中,axis是一个Axis对象,alpha是一个浮点数,表示要设置的透明度值。
2. 使用axis.Axis.set_alpha()函数的基本示例
让我们从一个简单的例子开始,展示如何使用set_alpha()函数来设置x轴的透明度:
import matplotlib.pyplot as plt

# 创建一个简单的图表
fig, ax = plt.subplots()
ax.plot([1, 2, 3, 4], [1, 4, 2, 3], label='how2matplotlib.com')

# 设置x轴的透明度为0.5
ax.xaxis.set_alpha(0.5)

plt.title('x轴透明度设置示例')
plt.legend()
plt.show()
Output:
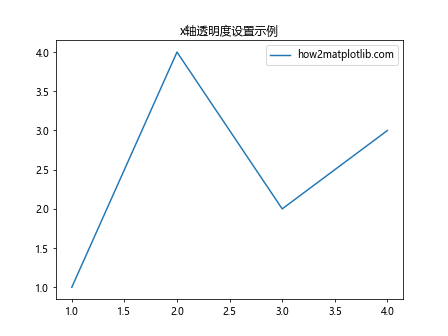
在这个例子中,我们创建了一个简单的线图,然后使用ax.xaxis.set_alpha(0.5)将x轴的透明度设置为0.5。这将使x轴及其相关元素变得半透明。
3. 同时设置x轴和y轴的透明度
你可能想同时设置x轴和y轴的透明度。以下是一个实现这一目的的示例:
import matplotlib.pyplot as plt

fig, ax = plt.subplots()
ax.plot([1, 2, 3, 4], [1, 4, 2, 3], label='how2matplotlib.com')

# 同时设置x轴和y轴的透明度
ax.xaxis.set_alpha(0.3)
ax.yaxis.set_alpha(0.7)

plt.title('x轴和y轴透明度设置示例')
plt.legend()
plt.show()
Output:
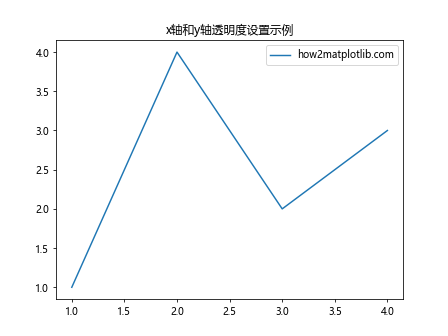
在这个例子中,我们将x轴的透明度设置为0.3,y轴的透明度设置为0.7。这样可以创建出轴透明度不同的有趣效果。
4. 使用set_alpha()函数实现渐变透明效果
通过在不同的子图中使用不同的透明度值,我们可以创建出渐变透明的效果:
import matplotlib.pyplot as plt

fig, (ax1, ax2, ax3) = plt.subplots(1, 3, figsize=(15, 5))

# 在三个子图中绘制相同的数据
for ax in (ax1, ax2, ax3):
    ax.plot([1, 2, 3, 4], [1, 4, 2, 3], label='how2matplotlib.com')
    ax.set_title('透明度: {:.1f}'.format(ax.xaxis.get_alpha()))
    ax.legend()

# 设置不同的透明度
ax1.xaxis.set_alpha(0.2)
ax1.yaxis.set_alpha(0.2)

ax2.xaxis.set_alpha(0.5)
ax2.yaxis.set_alpha(0.5)

ax3.xaxis.set_alpha(0.8)
ax3.yaxis.set_alpha(0.8)

plt.tight_layout()
plt.show()
这个例子创建了三个子图,每个子图的轴透明度不同,从而产生一种渐变效果。
5. 结合其他样式设置使用set_alpha()
set_alpha()函数可以与其他轴样式设置函数结合使用,以创建更复杂的视觉效果:
import matplotlib.pyplot as plt

fig, ax = plt.subplots()
ax.plot([1, 2, 3, 4], [1, 4, 2, 3], label='how2matplotlib.com')

# 设置x轴样式
ax.xaxis.set_alpha(0.5)
ax.xaxis.set_ticks_position('top')
ax.xaxis.set_label_position('top')
ax.set_xlabel('X轴标签')

# 设置y轴样式
ax.yaxis.set_alpha(0.7)
ax.yaxis.set_ticks_position('right')
ax.yaxis.set_label_position('right')
ax.set_ylabel('Y轴标签')

plt.title('结合其他样式的轴透明度设置')
plt.legend()
plt.show()
Output:
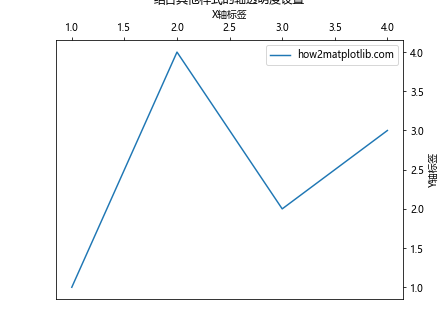
在这个例子中,我们不仅设置了轴的透明度,还改变了轴的位置和标签位置,创造出一个独特的图表样式。
6. 动态调整轴透明度
我们可以创建一个交互式的图表,允许用户动态调整轴的透明度:
import matplotlib.pyplot as plt
from matplotlib.widgets import Slider

fig, ax = plt.subplots()
plt.subplots_adjust(bottom=0.25)

# 绘制初始图形
line, = ax.plot([1, 2, 3, 4], [1, 4, 2, 3], label='how2matplotlib.com')
ax.set_title('动态调整轴透明度')
ax.legend()

# 创建滑块
axalpha = plt.axes([0.25, 0.1, 0.65, 0.03])
salpha = Slider(axalpha, 'Axis Alpha', 0, 1, valinit=1)

# 更新函数
def update(val):
    alpha = salpha.val
    ax.xaxis.set_alpha(alpha)
    ax.yaxis.set_alpha(alpha)
    fig.canvas.draw_idle()

salpha.on_changed(update)

plt.show()
Output:
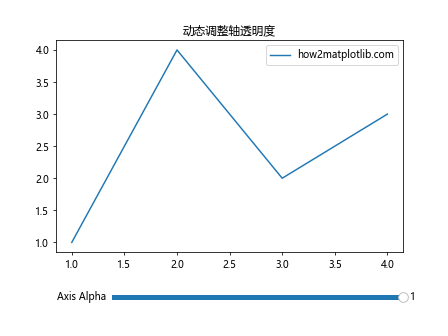
这个例子创建了一个带有滑块的图表,用户可以通过滑块来实时调整轴的透明度。
7. 在3D图中使用set_alpha()
set_alpha()函数也可以用于3D图的轴设置:
import matplotlib.pyplot as plt
from mpl_toolkits.mplot3d import Axes3D
import numpy as np

fig = plt.figure()
ax = fig.add_subplot(111, projection='3d')

# 生成数据
x = np.linspace(-5, 5, 100)
y = np.linspace(-5, 5, 100)
X, Y = np.meshgrid(x, y)
Z = np.sin(np.sqrt(X**2 + Y**2))

# 绘制3D表面
surf = ax.plot_surface(X, Y, Z, cmap='viridis', label='how2matplotlib.com')

# 设置轴透明度
ax.xaxis.set_alpha(0.5)
ax.yaxis.set_alpha(0.5)
ax.zaxis.set_alpha(0.5)

ax.set_title('3D图中的轴透明度设置')
plt.show()
Output:
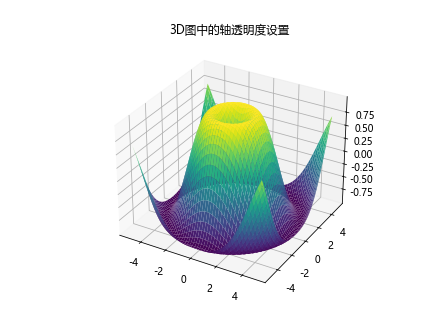
这个例子展示了如何在3D图中设置轴的透明度,包括z轴。
8. 结合颜色设置使用set_alpha()
我们可以结合颜色设置和透明度设置来创建更丰富的视觉效果:
import matplotlib.pyplot as plt

fig, ax = plt.subplots()
ax.plot([1, 2, 3, 4], [1, 4, 2, 3], label='how2matplotlib.com')

# 设置x轴样式
ax.xaxis.set_alpha(0.5)
ax.xaxis.label.set_color('red')
ax.tick_params(axis='x', colors='red')

# 设置y轴样式
ax.yaxis.set_alpha(0.7)
ax.yaxis.label.set_color('blue')
ax.tick_params(axis='y', colors='blue')

ax.set_xlabel('X轴')
ax.set_ylabel('Y轴')
plt.title('结合颜色的轴透明度设置')
plt.legend()
plt.show()
Output:
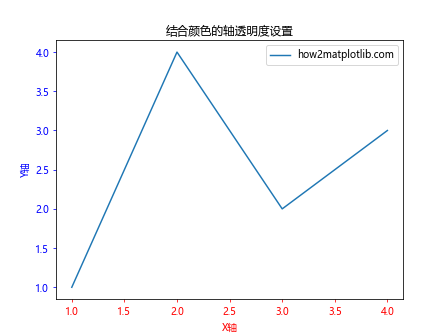
在这个例子中,我们不仅设置了轴的透明度,还为x轴和y轴设置了不同的颜色,创造出更加丰富的视觉效果。
9. 在多子图中使用set_alpha()
当我们有多个子图时,可以为每个子图单独设置轴透明度:
import matplotlib.pyplot as plt

fig, ((ax1, ax2), (ax3, ax4)) = plt.subplots(2, 2, figsize=(10, 10))

# 在所有子图中绘制相同的数据
for ax in (ax1, ax2, ax3, ax4):
    ax.plot([1, 2, 3, 4], [1, 4, 2, 3], label='how2matplotlib.com')
    ax.legend()

# 为每个子图设置不同的轴透明度
ax1.xaxis.set_alpha(0.2)
ax1.yaxis.set_alpha(0.2)
ax1.set_title('透明度: 0.2')

ax2.xaxis.set_alpha(0.4)
ax2.yaxis.set_alpha(0.4)
ax2.set_title('透明度: 0.4')

ax3.xaxis.set_alpha(0.6)
ax3.yaxis.set_alpha(0.6)
ax3.set_title('透明度: 0.6')

ax4.xaxis.set_alpha(0.8)
ax4.yaxis.set_alpha(0.8)
ax4.set_title('透明度: 0.8')

plt.tight_layout()
plt.show()
Output:
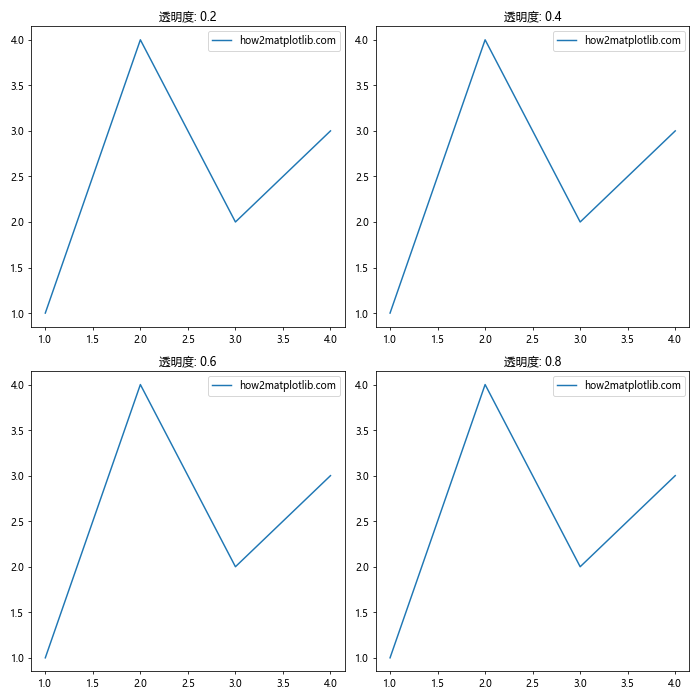
这个例子创建了四个子图,每个子图的轴透明度不同,让我们可以直观地比较不同透明度的效果。
10. 使用set_alpha()实现轴的渐变透明效果
我们可以创建一个轴透明度沿着轴渐变的效果:
import matplotlib.pyplot as plt
import numpy as np

fig, ax = plt.subplots()

# 创建渐变色
gradient = np.linspace(0, 1, 256).reshape(1, -1)
ax.imshow(gradient, aspect='auto', cmap='viridis', extent=[0, 10, 0, 10])

# 绘制数据
ax.plot([1, 5, 9], [2, 5, 8], 'ro-', label='how2matplotlib.com')

# 设置x轴的渐变透明度
for label in ax.xaxis.get_ticklabels():
    pos = label.get_position()[0]
    alpha = pos / 10  # 根据位置计算透明度
    label.set_alpha(alpha)

ax.set_title('轴标签渐变透明效果')
plt.legend()
plt.show()
Output:
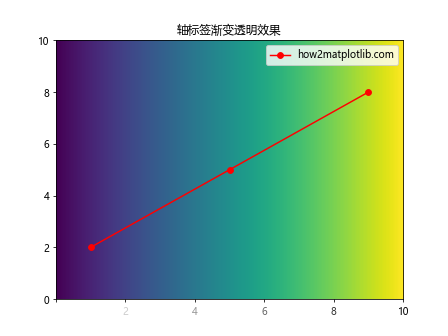
在这个例子中,我们为x轴的每个刻度标签设置了不同的透明度,创造出一种从左到右逐渐变得更透明的效果。
11. 在极坐标图中使用set_alpha()
set_alpha()函数也可以应用于极坐标图:
import matplotlib.pyplot as plt
import numpy as np

fig, ax = plt.subplots(subplot_kw=dict(projection='polar'))

# 生成数据
r = np.linspace(0, 2, 100)
theta = 2 * np.pi * r

# 绘制极坐标图
ax.plot(theta, r, label='how2matplotlib.com')

# 设置径向轴和角度轴的透明度
ax.xaxis.set_alpha(0.5)  # 角度轴
ax.yaxis.set_alpha(0.7)  # 径向轴

ax.set_title('极坐标图中的轴透明度设置')
plt.legend()
plt.show()
Output:
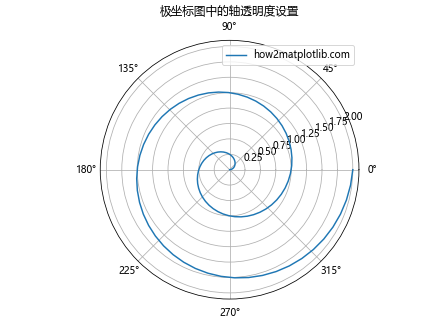
这个例子展示了如何在极坐标图中设置角度轴和径向轴的透明度。
12. 结合grid()函数使用set_alpha()
我们可以结合grid()函数和set_alpha()来创建透明的网格线:
import matplotlib.pyplot as plt

fig, ax = plt.subplots()
ax.plot([1, 2, 3, 4], [1, 4, 2, 3], label='how2matplotlib.com')

# 添加网格线并设置透明度
ax.grid(True, alpha=0.3)

# 设置轴的透明度
ax.xaxis.set_alpha(0.7)
ax.yaxis.set_alpha(0.7)

plt.title('透明网格线和轴')
plt.legend()
plt.show()
Output:
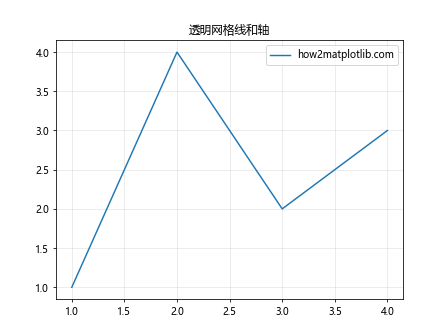
在这个例子中,我们不仅设置了轴的透明度,还添加了半透明的网格线,使图表更加清晰易读。
13. 在柱状图中使用set_alpha()
set_alpha()函数也可以用于柱状图的轴设置:
import matplotlib.pyplot as plt
import numpy as np

fig, ax = plt.subplots()

# 生成数据
categories = ['A', 'B', 'C', 'D']
values = [3, 7, 2, 5]

# 创建柱状图
bars = ax.bar(categories, values, label='how2matplotlib.com')

# 设置轴的透明度
ax.xaxis.set_alpha(0.5)
ax.yaxis.set_alpha(0.5)

# 为每个柱子设置不同的颜色
for i, bar in enumerate(bars):
    bar.set_color(plt.cm.viridis(i / len(bars)))

plt.title('柱状图中的轴透明度设置')
plt.legend()
plt.show()
Output:
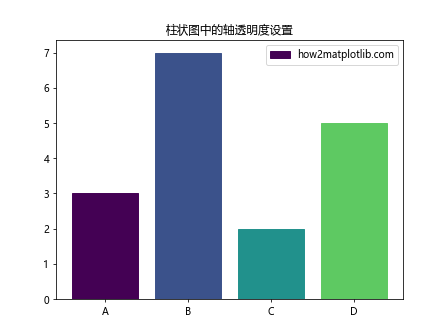
这个例子展示了如何在柱状图中设置轴的透明度,同时为每个柱子设置不同的颜色,创造出更加丰富的视觉效果。
14. 在散点图中使用set_alpha()
我们也可以在散点图中应用set_alpha()函数:
import matplotlib.pyplot as plt
import numpy as np

fig, ax = plt.subplots()

# 生成随机数据
np.random.seed(42)
x = np.random.rand(50)
y = np.random.rand(50)

# 创建散点图
scatter = ax.scatter(x, y, c=np.random.rand(50), cmap='viridis', s=100, label='how2matplotlib.com')

# 设置轴的透明度
ax.xaxis.set_alpha(0.6)
ax.yaxis.set_alpha(0.6)

plt.title('散点图中的轴透明度设置')
plt.colorbar(scatter)
plt.legend()
plt.show()
Output:
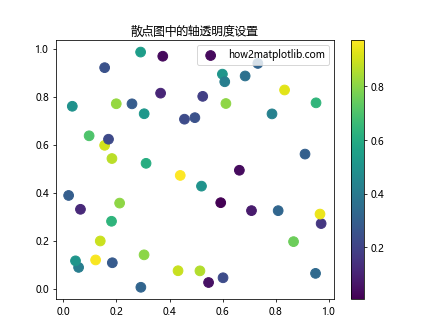
这个例子展示了如何在散点图中设置轴的透明度,同时使用颜色映射来表示额外的数据维度。
15. 在箱线图中使用set_alpha()
set_alpha()函数同样适用于箱线图:
import matplotlib.pyplot as plt
import numpy as np

fig, ax = plt.subplots()

# 生成随机数据
np.random.seed(42)
data = [np.random.normal(0, std, 100) for std in range(1, 4)]

# 创建箱线图
box_plot = ax.boxplot(data, patch_artist=True, labels=['A', 'B', 'C'])

# 设置轴的透明度
ax.xaxis.set_alpha(0.7)
ax.yaxis.set_alpha(0.7)

# 为每个箱子设置不同的颜色
colors = ['lightblue', 'lightgreen', 'lightpink']
for patch, color in zip(box_plot['boxes'], colors):
    patch.set_facecolor(color)

plt.title('箱线图中的轴透明度设置')
plt.text(0.5, -0.15, 'how2matplotlib.com', ha='center', va='center', transform=ax.transAxes)
plt.show()
Output:
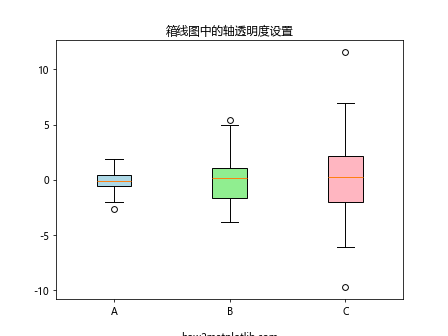
这个例子展示了如何在箱线图中设置轴的透明度,并为每个箱子设置不同的颜色。
16. 在热力图中使用set_alpha()
热力图是另一种可以应用set_alpha()函数的图表类型:
import matplotlib.pyplot as plt
import numpy as np

fig, ax = plt.subplots()

# 生成数据
data = np.random.rand(10, 10)

# 创建热力图
heatmap = ax.imshow(data, cmap='viridis')

# 设置轴的透明度
ax.xaxis.set_alpha(0.5)
ax.yaxis.set_alpha(0.5)

plt.title('热力图中的轴透明度设置')
plt.colorbar(heatmap)
plt.text(0.5, -0.15, 'how2matplotlib.com', ha='center', va='center', transform=ax.transAxes)
plt.show()
Output:
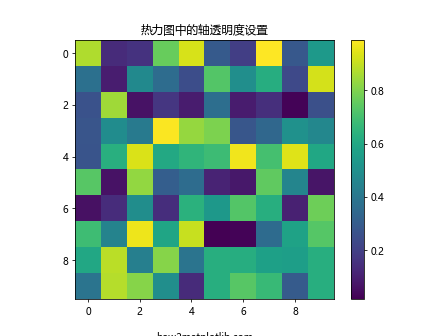
这个例子展示了如何在热力图中设置轴的透明度,使得热力图的颜色更加突出。
17. 在等高线图中使用set_alpha()
等高线图也可以使用set_alpha()函数来调整轴的透明度:
import matplotlib.pyplot as plt
import numpy as np

fig, ax = plt.subplots()

# 生成数据
x = np.linspace(-3, 3, 100)
y = np.linspace(-3, 3, 100)
X, Y = np.meshgrid(x, y)
Z = np.sin(X) * np.cos(Y)

# 创建等高线图
contour = ax.contourf(X, Y, Z, cmap='viridis')

# 设置轴的透明度
ax.xaxis.set_alpha(0.6)
ax.yaxis.set_alpha(0.6)

plt.title('等高线图中的轴透明度设置')
plt.colorbar(contour)
plt.text(0.5, -0.15, 'how2matplotlib.com', ha='center', va='center', transform=ax.transAxes)
plt.show()
Output:
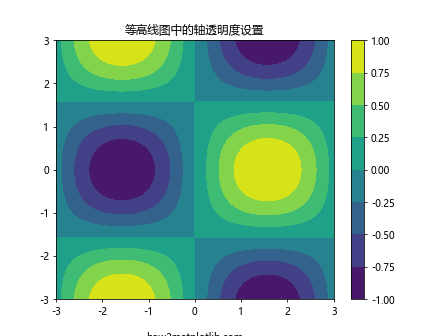
这个例子展示了如何在等高线图中设置轴的透明度,使得等高线的颜色更加突出。
18. 在极坐标柱状图中使用set_alpha()
我们还可以在极坐标柱状图中应用set_alpha()函数:
import matplotlib.pyplot as plt
import numpy as np

fig, ax = plt.subplots(subplot_kw=dict(projection='polar'))

# 生成数据
N = 8
theta = np.linspace(0.0, 2 * np.pi, N, endpoint=False)
radii = np.random.rand(N)
width = np.pi / 4 * np.random.rand(N)

# 创建极坐标柱状图
bars = ax.bar(theta, radii, width=width, bottom=0.0)

# 设置轴的透明度
ax.xaxis.set_alpha(0.5)  # 角度轴
ax.yaxis.set_alpha(0.5)  # 径向轴

# 为每个柱子设置不同的颜色
for bar in bars:
    bar.set_facecolor(plt.cm.viridis(np.random.random()))

plt.title('极坐标柱状图中的轴透明度设置')
plt.text(0.5, -0.1, 'how2matplotlib.com', ha='center', va='center', transform=ax.transAxes)
plt.show()
Output:
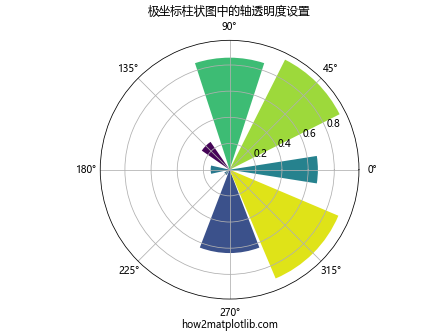
这个例子展示了如何在极坐标柱状图中设置轴的透明度,并为每个柱子设置不同的颜色。
19. 在雷达图中使用set_alpha()
雷达图是另一种可以应用set_alpha()函数的图表类型:
import matplotlib.pyplot as plt
import numpy as np

fig, ax = plt.subplots(subplot_kw=dict(projection='polar'))

# 生成数据
categories = ['A', 'B', 'C', 'D', 'E']
values = [4, 3, 5, 2, 4]
N = len(categories)

# 计算角度
angles = [n / float(N) * 2 * np.pi for n in range(N)]
values += values[:1]
angles += angles[:1]

# 绘制雷达图
ax.plot(angles, values)
ax.fill(angles, values, alpha=0.3)

# 设置刻度标签
ax.set_xticks(angles[:-1])
ax.set_xticklabels(categories)

# 设置轴的透明度
ax.xaxis.set_alpha(0.7)
ax.yaxis.set_alpha(0.7)

plt.title('雷达图中的轴透明度设置')
plt.text(0.5, -0.1, 'how2matplotlib.com', ha='center', va='center', transform=ax.transAxes)
plt.show()
Output:
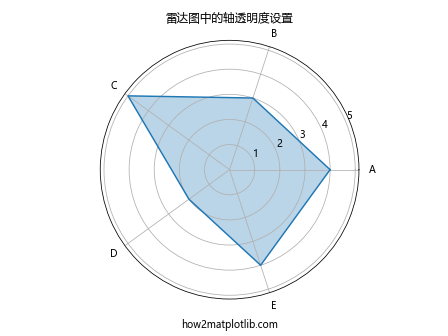
这个例子展示了如何在雷达图中设置轴的透明度,使得图表更加清晰易读。
20. 在误差棒图中使用set_alpha()
最后,让我们看看如何在误差棒图中应用set_alpha()函数:
import matplotlib.pyplot as plt
import numpy as np

fig, ax = plt.subplots()

# 生成数据
x = np.arange(1, 5)
y = np.random.rand(4)
error = np.random.rand(4) * 0.1

# 创建误差棒图
ax.errorbar(x, y, yerr=error, fmt='o', capsize=5, label='how2matplotlib.com')

# 设置轴的透明度
ax.xaxis.set_alpha(0.6)
ax.yaxis.set_alpha(0.6)

plt.title('误差棒图中的轴透明度设置')
plt.legend()
plt.show()
Output:
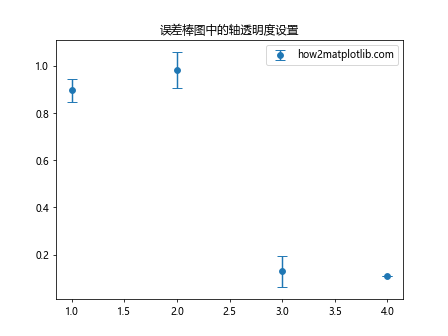
这个例子展示了如何在误差棒图中设置轴的透明度,使得误差棒更加突出。
总结
通过以上20个详细的示例,我们全面探讨了Matplotlib中axis.Axis.set_alpha()函数的使用方法和应用场景。这个函数为我们提供了一种简单而有效的方式来调整图表轴的透明度,从而创造出各种有趣的视觉效果。
无论是在基本的线图、柱状图,还是在更复杂的3D图、极坐标图或热力图中,set_alpha()函数都能够很好地发挥作用。通过调整轴的透明度,我们可以突出图表的重要部分,减少不必要的视觉干扰,或者创造出独特的美学效果。
在实际应用中,合理使用set_alpha()函数可以大大提升图表的可读性和美观度。但需要注意的是,透明度的设置应该根据具体的数据和图表类型来决定,过度使用可能会影响图表的清晰度。
总的来说,axis.Axis.set_alpha()函数是Matplotlib库中一个强大而灵活的工具,掌握它的使用方法将使你的数据可视化技能更上一层楼。
 极客教程
极客教程