Matplotlib中的axis.Axis.get_children()函数详解与应用
参考:Matplotlib.axis.Axis.get_children() function in Python
Matplotlib是Python中最流行的数据可视化库之一,它提供了丰富的绘图功能和灵活的自定义选项。在Matplotlib中,axis.Axis.get_children()函数是一个非常有用的工具,它允许我们获取轴对象的所有子对象。本文将深入探讨这个函数的用法、应用场景以及相关的示例代码,帮助读者更好地理解和使用这个强大的功能。
1. axis.Axis.get_children()函数简介
axis.Axis.get_children()是Matplotlib库中Axis类的一个方法。这个函数返回一个包含轴对象所有子对象的列表。这些子对象可能包括刻度线、刻度标签、网格线等元素。通过使用这个函数,我们可以轻松地访问和操作轴的各个组成部分,从而实现更精细的图表定制。
让我们来看一个简单的示例,了解如何使用这个函数:
import matplotlib.pyplot as plt

# 创建一个简单的图表
fig, ax = plt.subplots()
ax.plot([1, 2, 3, 4], [1, 4, 2, 3], label='how2matplotlib.com')

# 获取x轴的所有子对象
x_axis_children = ax.xaxis.get_children()

# 打印子对象的数量
print(f"X轴子对象数量: {len(x_axis_children)}")

plt.show()
Output:
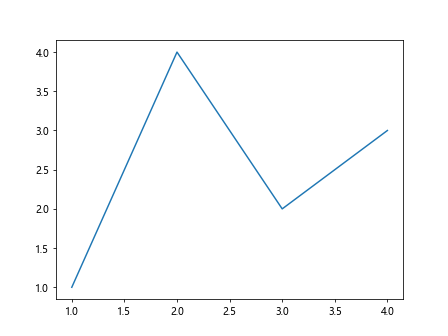
在这个例子中,我们创建了一个简单的线图,然后使用get_children()函数获取了x轴的所有子对象。这个函数返回一个列表,我们可以通过查看列表的长度来了解子对象的数量。
2. 理解轴对象的结构
要充分利用get_children()函数,我们需要先了解轴对象的结构。在Matplotlib中,轴对象包含多个子对象,主要包括:
- 刻度线(Tick lines)
- 刻度标签(Tick labels)
- 轴标签(Axis labels)
- 网格线(Grid lines)
- 轴线(Spine lines)
每个子对象都有自己的属性和方法,我们可以通过get_children()函数获取这些对象,然后对它们进行个性化设置。
下面是一个展示如何访问和修改这些子对象的示例:
import matplotlib.pyplot as plt

fig, ax = plt.subplots()
ax.plot([1, 2, 3, 4], [1, 4, 2, 3], label='how2matplotlib.com')

# 获取x轴的所有子对象
x_axis_children = ax.xaxis.get_children()

# 修改刻度线的颜色
for child in x_axis_children:
    if isinstance(child, plt.Line2D):
        child.set_color('red')

# 修改刻度标签的字体大小
for child in x_axis_children:
    if isinstance(child, plt.Text):
        child.set_fontsize(14)

plt.show()
Output:
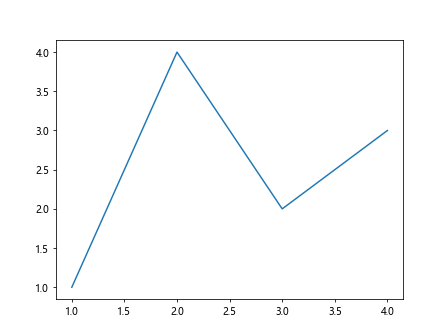
在这个例子中,我们遍历了x轴的所有子对象,并根据对象的类型进行了不同的设置。我们将刻度线的颜色改为红色,并增大了刻度标签的字体大小。
3. 使用get_children()函数进行高级定制
get_children()函数的强大之处在于它允许我们对图表的各个部分进行精细的控制。以下是一些常见的应用场景:
3.1 修改特定刻度的样式
有时我们可能想要突出显示某些特定的刻度。使用get_children()函数,我们可以轻松实现这一目标:
import matplotlib.pyplot as plt

fig, ax = plt.subplots()
ax.plot([1, 2, 3, 4, 5], [1, 4, 2, 3, 5], label='how2matplotlib.com')

# 获取x轴的所有子对象
x_axis_children = ax.xaxis.get_children()

# 修改特定刻度的样式
for child in x_axis_children:
    if isinstance(child, plt.Text):
        if child.get_text() == '3':
            child.set_color('red')
            child.set_fontweight('bold')

plt.show()
Output:
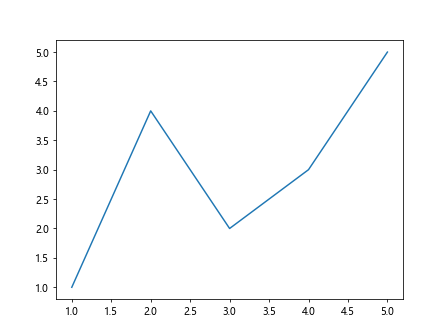
在这个例子中,我们遍历了x轴的所有子对象,找到了值为’3’的刻度标签,并将其颜色设置为红色,字体设置为粗体。
3.2 自定义网格线
get_children()函数也可以用来自定义网格线的样式:
import matplotlib.pyplot as plt

fig, ax = plt.subplots()
ax.plot([1, 2, 3, 4], [1, 4, 2, 3], label='how2matplotlib.com')
ax.grid(True)

# 获取所有子对象
all_children = ax.get_children()

# 自定义网格线
for child in all_children:
    if isinstance(child, plt.Line2D) and child.get_linestyle() == ':':
        child.set_color('green')
        child.set_linestyle('--')
        child.set_linewidth(0.5)

plt.show()
Output:
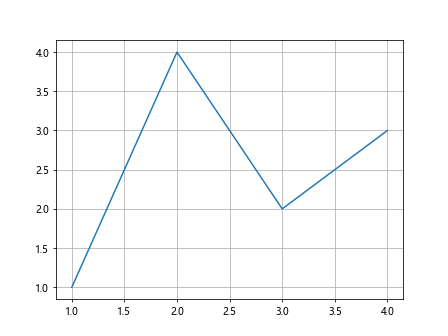
在这个例子中,我们遍历了所有子对象,找到了网格线(通过检查线型是否为虚线),然后修改了它们的颜色、线型和线宽。
3.3 动态调整刻度标签
使用get_children()函数,我们可以动态地调整刻度标签的内容和样式:
import matplotlib.pyplot as plt

fig, ax = plt.subplots()
ax.plot([1, 2, 3, 4], [1, 4, 2, 3], label='how2matplotlib.com')

# 获取x轴的所有子对象
x_axis_children = ax.xaxis.get_children()

# 动态调整刻度标签
for child in x_axis_children:
    if isinstance(child, plt.Text):
        current_text = child.get_text()
        child.set_text(f"Value: {current_text}")
        child.set_rotation(45)

plt.tight_layout()
plt.show()
Output:
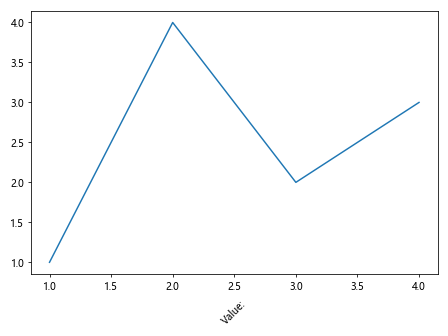
在这个例子中,我们遍历了x轴的所有子对象,找到了刻度标签,然后修改了它们的文本内容并旋转了45度。
4. 处理多个轴对象
在一些复杂的图表中,我们可能需要处理多个轴对象。get_children()函数在这种情况下也非常有用:
import matplotlib.pyplot as plt

fig, (ax1, ax2) = plt.subplots(2, 1, figsize=(8, 8))
ax1.plot([1, 2, 3, 4], [1, 4, 2, 3], label='how2matplotlib.com')
ax2.plot([1, 2, 3, 4], [3, 1, 4, 2], label='how2matplotlib.com')

# 处理两个轴对象
for ax in (ax1, ax2):
    x_axis_children = ax.xaxis.get_children()
    y_axis_children = ax.yaxis.get_children()

    # 修改x轴刻度标签
    for child in x_axis_children:
        if isinstance(child, plt.Text):
            child.set_color('blue')

    # 修改y轴刻度线
    for child in y_axis_children:
        if isinstance(child, plt.Line2D):
            child.set_linewidth(2)

plt.tight_layout()
plt.show()
Output:
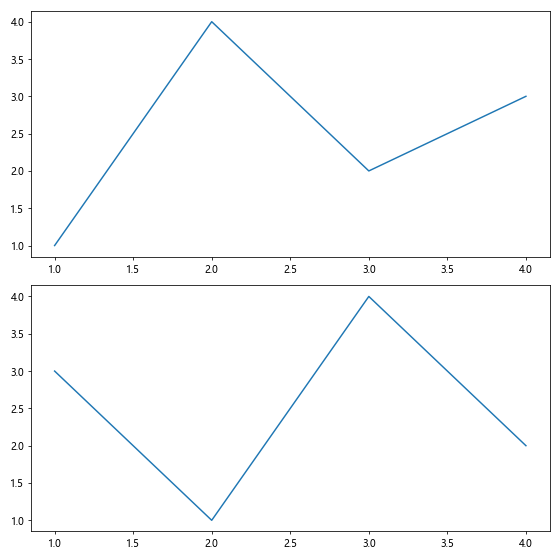
在这个例子中,我们创建了两个子图,并对每个子图的x轴和y轴进行了不同的设置。我们将x轴的刻度标签颜色设置为蓝色,并增加了y轴刻度线的宽度。
5. 结合其他Matplotlib功能
get_children()函数可以与Matplotlib的其他功能结合使用,以实现更复杂的图表定制:
5.1 结合颜色映射
我们可以结合颜色映射来创建渐变效果的刻度标签:
import matplotlib.pyplot as plt
import matplotlib.cm as cm

fig, ax = plt.subplots()
ax.plot([1, 2, 3, 4, 5], [1, 4, 2, 3, 5], label='how2matplotlib.com')

# 获取x轴的所有子对象
x_axis_children = ax.xaxis.get_children()

# 创建颜色映射
cmap = cm.get_cmap('viridis')

# 应用渐变颜色到刻度标签
for i, child in enumerate(x_axis_children):
    if isinstance(child, plt.Text):
        color = cmap(i / len(x_axis_children))
        child.set_color(color)

plt.show()
Output:
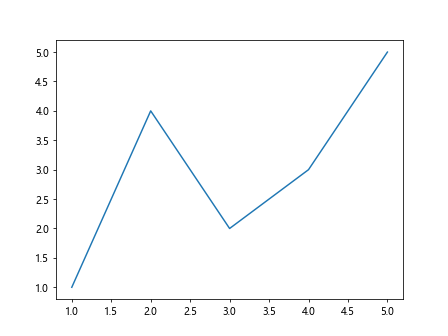
在这个例子中,我们使用了’viridis’颜色映射来为x轴的刻度标签创建了一个渐变效果。
5.2 添加自定义注释
我们可以使用get_children()函数来定位特定的刻度,然后在其附近添加自定义注释:
import matplotlib.pyplot as plt

fig, ax = plt.subplots()
ax.plot([1, 2, 3, 4, 5], [1, 4, 2, 3, 5], label='how2matplotlib.com')

# 获取x轴的所有子对象
x_axis_children = ax.xaxis.get_children()

# 添加自定义注释
for child in x_axis_children:
    if isinstance(child, plt.Text):
        if child.get_text() == '3':
            ax.annotate('Peak', xy=(3, 2), xytext=(3, 2.5),
                        arrowprops=dict(facecolor='black', shrink=0.05))

plt.show()
Output:
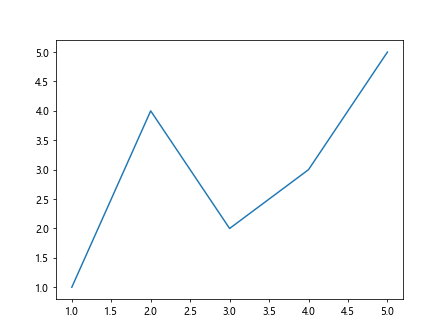
在这个例子中,我们在x轴值为3的位置添加了一个指向数据点的注释。
6. 处理复杂的图表元素
get_children()函数不仅可以用于处理基本的轴元素,还可以用于处理更复杂的图表元素,如图例、标题等:
import matplotlib.pyplot as plt

fig, ax = plt.subplots()
ax.plot([1, 2, 3, 4], [1, 4, 2, 3], label='how2matplotlib.com')
ax.set_title('Sample Plot')
ax.legend()

# 获取所有子对象
all_children = ax.get_children()

# 修改图例和标题
for child in all_children:
    if isinstance(child, plt.Legend):
        child.get_texts()[0].set_fontsize(14)
    elif isinstance(child, plt.Text) and child.get_text() == 'Sample Plot':
        child.set_fontsize(16)
        child.set_color('red')

plt.show()
在这个例子中,我们修改了图例中文本的字体大小,以及标题的字体大小和颜色。
7. 处理3D图表
get_children()函数也可以用于3D图表,让我们来看一个例子:
import matplotlib.pyplot as plt
from mpl_toolkits.mplot3d import Axes3D
import numpy as np

fig = plt.figure()
ax = fig.add_subplot(111, projection='3d')

# 创建一些示例数据
x = np.arange(-5, 5, 0.25)
y = np.arange(-5, 5, 0.25)
x, y = np.meshgrid(x, y)
r = np.sqrt(x**2 + y**2)
z = np.sin(r)

# 绘制3D表面
surf = ax.plot_surface(x, y, z, cmap='viridis', label='how2matplotlib.com')

# 获取所有子对象
all_children = ax.get_children()

# 修改3D图表的元素
for child in all_children:
    if isinstance(child, plt.Line2D):
        child.set_linewidth(2)
    elif isinstance(child, plt.Text):
        child.set_fontsize(12)

plt.show()
Output:
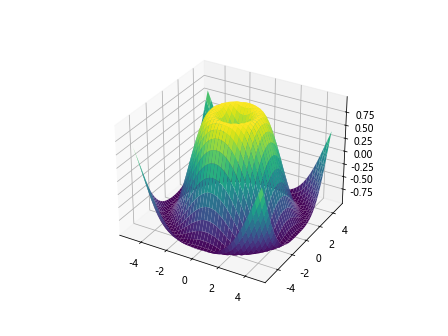
在这个例子中,我们创建了一个3D表面图,然后使用get_children()函数来修改图表中的线条宽度和文本字体大小。
8. 动态更新图表
get_children()函数还可以用于动态更新图表。以下是一个简单的动画示例:
import matplotlib.pyplot as plt
import numpy as np
from matplotlib.animation import FuncAnimation

fig, ax = plt.subplots()
line, = ax.plot([], [], label='how2matplotlib.com')
ax.set_xlim(0, 2*np.pi)
ax.set_ylim(-1, 1)

def update(frame):
    x = np.linspace(0, 2*np.pi, 100)
    y = np.sin(x + frame/10)
    line.set_data(x, y)

    # 获取所有子对象
    all_children = ax.get_children()

    # 动态更新刻度标签颜色
    for child in all_children:
        if isinstance(child, plt.Text):
            child.set_color(plt.cm.viridis(frame/100))

    return line,

ani = FuncAnimation(fig, update, frames=100, blit=True)
plt.show()
Output:
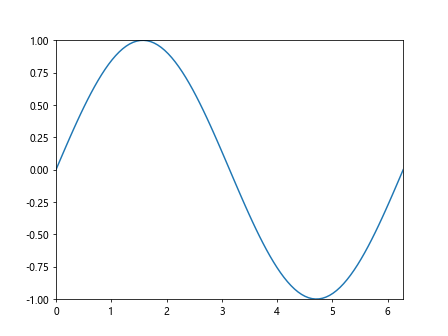
在这个例子中,我们创建了一个简单的正弦波动画,并在每一帧中使用get_children()函数来动态更新刻度标签的颜色。
9. 处理多个子图
当处理包含多个子图的复杂图表时,get_children()函数也能派上用场。让我们看一个例子:
import matplotlib.pyplot as plt
import numpy as np

fig, axs = plt.subplots(2, 2, figsize=(10, 10))
fig.suptitle('Multiple Subplots Example - how2matplotlib.com', fontsize=16)

# 在每个子图中绘制不同的图形
axs[0, 0].plot([1, 2, 3, 4], [1, 4, 2, 3])
axs[0, 1].scatter([1, 2, 3, 4], [1, 4, 2, 3])
axs[1, 0].bar([1, 2, 3, 4], [1, 4, 2, 3])
axs[1, 1].imshow(np.random.rand(10, 10), cmap='viridis')

# 遍历所有子图
for i in range(2):
    for j in range(2):
        # 获取当前子图的所有子对象
        children = axs[i, j].get_children()

        # 修改子图中的元素
        for child in children:
            if isinstance(child, plt.Line2D):
                child.set_linewidth(2)
            elif isinstance(child, plt.Text):
                child.set_fontsize(10)
                child.set_color('red')

plt.tight_layout()
plt.show()
Output:
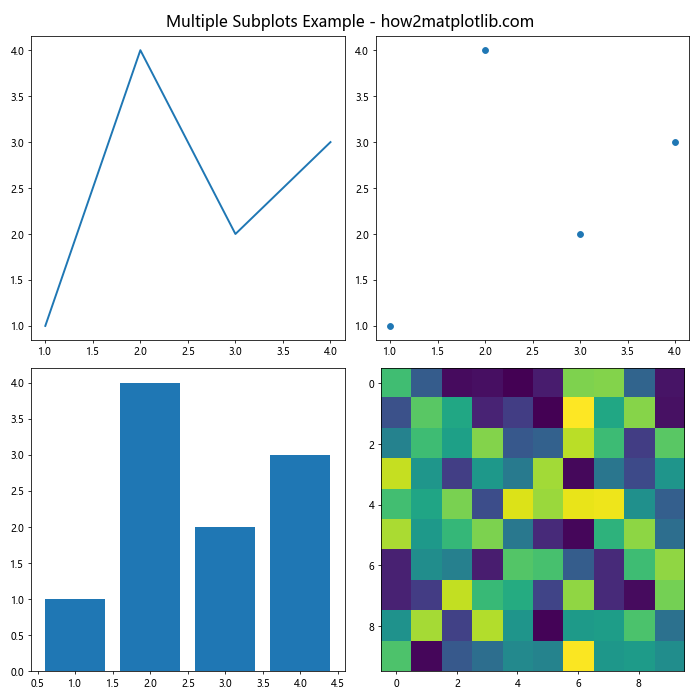
在这个例子中,我们创建了一个2×2的子图网格,每个子图包含不同类型的图形。然后,我们使用嵌套循环遍历所有子图,并使用get_children()函数来修改每个子图中的元素。
10. 结合自定义样式
get_children()函数可以与Matplotlib的自定义样式结合使用,以创建独特的图表外观:
import matplotlib.pyplot as plt
import matplotlib as mpl

# 创建自定义样式
custom_style = {
    'axes.facecolor': '#f0f0f0',
    'axes.edgecolor': '#333333',
    'axes.labelcolor': '#555555',
    'text.color': '#222222',
    'xtick.color': '#666666',
    'ytick.color': '#666666',
    'grid.color': '#cccccc',
}

# 应用自定义样式
plt.style.use(custom_style)

fig, ax = plt.subplots()
ax.plot([1, 2, 3, 4], [1, 4, 2, 3], label='how2matplotlib.com')
ax.set_title('Custom Style Example')
ax.grid(True)

# 获取所有子对象
all_children = ax.get_children()

# 进一步自定义元素
for child in all_children:
    if isinstance(child, plt.Line2D):
        if child.get_linestyle() == '--':  # 网格线
            child.set_alpha(0.5)
    elif isinstance(child, plt.Text):
        child.set_fontname('Arial')

plt.show()
Output:
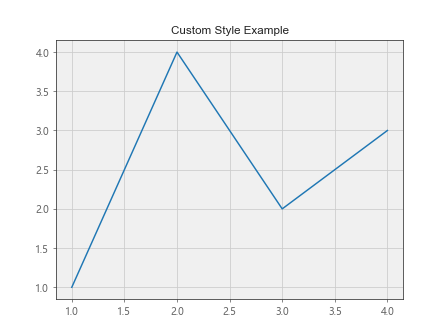
在这个例子中,我们首先定义了一个自定义样式字典,然后使用plt.style.use()应用这个样式。之后,我们使用get_children()函数来进一步自定义图表中的元素,如调整网格线的透明度和文本的字体。
11. 处理极坐标图
get_children()函数同样适用于极坐标图:
import matplotlib.pyplot as plt
import numpy as np

fig, ax = plt.subplots(subplot_kw=dict(projection='polar'))
r = np.arange(0, 2, 0.01)
theta = 2 * np.pi * r
ax.plot(theta, r, label='how2matplotlib.com')

# 获取所有子对象
all_children = ax.get_children()

# 自定义极坐标图的元素
for child in all_children:
    if isinstance(child, plt.Line2D):
        if child.get_linestyle() == '-':  # 主要曲线
            child.set_linewidth(2)
            child.set_color('red')
    elif isinstance(child, plt.Text):
        child.set_fontsize(8)
        child.set_color('blue')

plt.show()
Output:
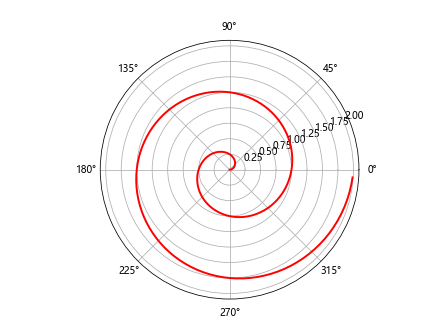
在这个例子中,我们创建了一个简单的极坐标图,然后使用get_children()函数来自定义图表中的线条和文本元素。
12. 处理颜色条
当处理包含颜色条的图表时,get_children()函数也可以派上用场:
import matplotlib.pyplot as plt
import numpy as np

fig, ax = plt.subplots()
data = np.random.rand(10, 10)
im = ax.imshow(data, cmap='viridis')
cbar = fig.colorbar(im)

# 获取颜色条的所有子对象
cbar_children = cbar.ax.get_children()

# 自定义颜色条
for child in cbar_children:
    if isinstance(child, plt.Text):
        child.set_fontsize(8)
        child.set_color('red')

# 获取主轴的所有子对象
ax_children = ax.get_children()

# 自定义主图
for child in ax_children:
    if isinstance(child, plt.Text):
        child.set_fontsize(10)
        child.set_fontweight('bold')

plt.title('Colorbar Example - how2matplotlib.com')
plt.show()
Output:
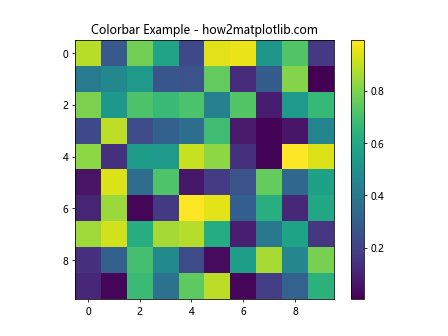
在这个例子中,我们创建了一个热图并添加了颜色条。然后,我们分别使用get_children()函数来自定义颜色条和主图中的元素。
13. 处理箱线图
get_children()函数也可以用于自定义箱线图的各个组成部分:
import matplotlib.pyplot as plt
import numpy as np

fig, ax = plt.subplots()
data = [np.random.normal(0, std, 100) for std in range(1, 4)]
box_plot = ax.boxplot(data, patch_artist=True, labels=['A', 'B', 'C'])

# 获取所有子对象
all_children = ax.get_children()

# 自定义箱线图的元素
for child in all_children:
    if isinstance(child, plt.Line2D):
        child.set_color('red')  # 设置须线颜色
    elif isinstance(child, plt.patches.Rectangle):
        child.set_facecolor('lightblue')  # 设置箱体颜色
    elif isinstance(child, plt.Text):
        child.set_fontsize(12)
        child.set_fontweight('bold')

plt.title('Boxplot Example - how2matplotlib.com')
plt.show()
在这个例子中,我们创建了一个箱线图,然后使用get_children()函数来自定义图表中的线条、箱体和文本元素。
14. 结合seaborn库
虽然get_children()函数是Matplotlib的一部分,但我们也可以在使用seaborn库创建的图表上使用它:
import matplotlib.pyplot as plt
import seaborn as sns
import numpy as np

# 创建示例数据
tips = sns.load_dataset("tips")

# 使用seaborn创建图表
fig, ax = plt.subplots(figsize=(10, 6))
sns.scatterplot(data=tips, x="total_bill", y="tip", hue="time", ax=ax)

# 获取所有子对象
all_children = ax.get_children()

# 自定义seaborn图表的元素
for child in all_children:
    if isinstance(child, plt.Line2D):
        child.set_markersize(8)  # 增大散点大小
    elif isinstance(child, plt.Text):
        child.set_fontsize(10)
        child.set_fontweight('bold')

plt.title('Seaborn Scatterplot with Matplotlib Customization - how2matplotlib.com')
plt.show()
Output:
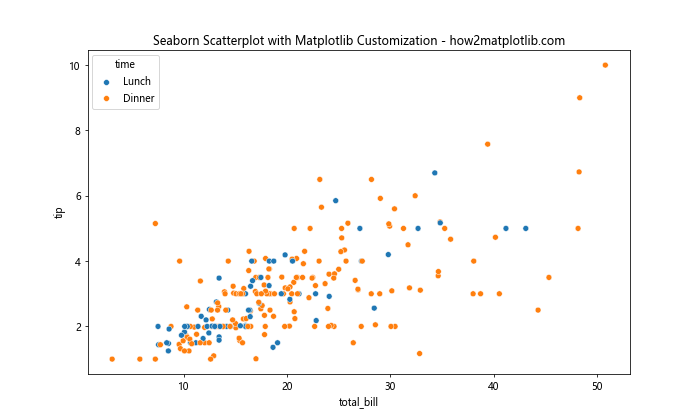
在这个例子中,我们使用seaborn创建了一个散点图,然后使用Matplotlib的get_children()函数来进一步自定义图表元素。
15. 总结
通过本文的详细介绍和丰富的示例,我们深入探讨了Matplotlib中axis.Axis.get_children()函数的用法和应用场景。这个强大的函数允许我们访问和修改图表中的各种元素,从而实现高度自定义的数据可视化效果。
我们学习了如何:
1. 获取轴对象的子对象
2. 修改特定类型的子对象(如刻度线、刻度标签等)
3. 在复杂的图表中应用get_children()函数
4. 结合其他Matplotlib功能和样式
5. 在不同类型的图表中使用get_children()函数
通过掌握get_children()函数,我们可以更灵活地控制图表的每个细节,创建出既美观又富有信息量的数据可视化作品。无论是简单的线图还是复杂的多子图布局,get_children()函数都能帮助我们实现精确的自定义。
在实际应用中,建议读者根据具体需求和图表类型,灵活运用get_children()函数。同时,也要注意平衡图表的美观性和可读性,避免过度修改导致图表难以理解。
 极客教程
极客教程