Matplotlib中的Axes.draw_artist()方法:高效绘图技巧详解
参考:Matplotlib.axes.Axes.draw_artist() in Python
Matplotlib是Python中最流行的数据可视化库之一,它提供了丰富的绘图功能和灵活的自定义选项。在Matplotlib的众多方法中,Axes.draw_artist()是一个强大而独特的工具,它允许开发者以更高效和精细的方式控制绘图过程。本文将深入探讨Axes.draw_artist()方法的使用,包括其原理、应用场景以及与其他绘图方法的比较。
1. Axes.draw_artist()方法简介
Axes.draw_artist()是Matplotlib库中Axes类的一个方法,它用于重新绘制特定的艺术家对象(Artist)。在Matplotlib中,几乎所有可见的元素都是艺术家对象,如线条、文本、图例等。这个方法允许我们选择性地更新画布上的特定元素,而不是重新绘制整个图形,从而提高绘图效率,特别是在需要频繁更新的动画或交互式图形中。
1.1 基本语法
import matplotlib.pyplot as plt

fig, ax = plt.subplots()
line, = ax.plot([1, 2, 3], [1, 2, 3], label='Line for how2matplotlib.com')
ax.draw_artist(line)
fig.canvas.blit(ax.bbox)
plt.show()
Output:
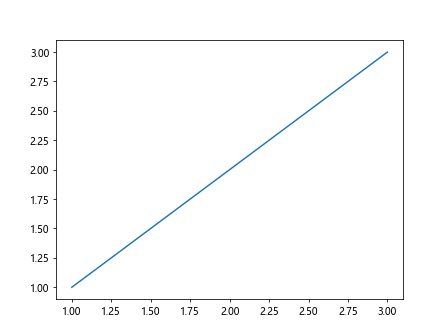
在这个简单的例子中,我们首先创建了一个图形和轴对象,然后绘制了一条线。使用draw_artist()方法重新绘制这条线,最后通过blit()方法更新画布。这个过程比重新绘制整个图形要快得多。
2. draw_artist()方法的工作原理
draw_artist()方法的核心原理是选择性重绘。它只更新指定的艺术家对象,而不是重新绘制整个图形。这种方法特别适用于需要频繁更新的动画或交互式图形,因为它可以显著提高性能。
2.1 与传统绘图方法的比较
传统的Matplotlib绘图流程通常涉及清除整个轴或图形,然后重新绘制所有元素。而draw_artist()允许我们只更新需要变化的部分,保持其他元素不变。
import matplotlib.pyplot as plt
import numpy as np

# 传统方法
fig, ax = plt.subplots()
x = np.linspace(0, 10, 100)
line, = ax.plot(x, np.sin(x), label='Sine wave for how2matplotlib.com')

for i in range(100):
    line.set_ydata(np.sin(x + i/10.0))
    plt.draw()
    plt.pause(0.1)

# 使用draw_artist()
fig, ax = plt.subplots()
x = np.linspace(0, 10, 100)
line, = ax.plot(x, np.sin(x), label='Sine wave for how2matplotlib.com')
ax.draw_artist(ax.patch)
ax.draw_artist(line)
fig.canvas.blit(ax.bbox)

for i in range(100):
    line.set_ydata(np.sin(x + i/10.0))
    ax.draw_artist(line)
    fig.canvas.blit(ax.bbox)
    plt.pause(0.1)

plt.show()
在这个例子中,我们比较了传统方法和使用draw_artist()方法更新动画的差异。使用draw_artist()的版本通常会运行得更快,尤其是在复杂图形中。
3. 使用draw_artist()的优势
3.1 提高性能
draw_artist()方法的主要优势在于其性能。通过只更新需要变化的部分,它可以显著减少绘图时间,特别是在处理大量数据或复杂图形时。
import matplotlib.pyplot as plt
import numpy as np
import time

# 性能比较
fig, ax = plt.subplots()
x = np.linspace(0, 10, 1000)
line, = ax.plot(x, np.sin(x), label='Performance test for how2matplotlib.com')

# 传统方法
start_time = time.time()
for i in range(100):
    line.set_ydata(np.sin(x + i/100.0))
    fig.canvas.draw()
print(f"Traditional method time: {time.time() - start_time}")

# 使用draw_artist()
start_time = time.time()
for i in range(100):
    line.set_ydata(np.sin(x + i/100.0))
    ax.draw_artist(line)
    fig.canvas.blit(ax.bbox)
print(f"draw_artist() method time: {time.time() - start_time}")

plt.show()
Output:
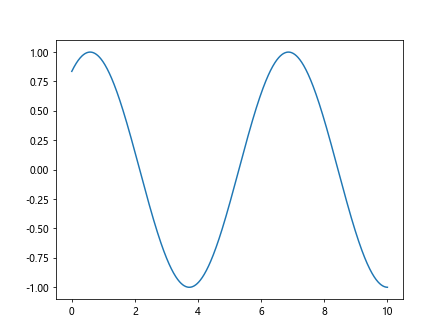
这个例子比较了传统方法和draw_artist()方法在更新图形时的性能差异。通常,draw_artist()方法会显示出明显的性能优势。
3.2 精细控制
draw_artist()允许对绘图过程进行更精细的控制。我们可以选择只更新特定的元素,而保持其他元素不变。
import matplotlib.pyplot as plt
import numpy as np

fig, ax = plt.subplots()
x = np.linspace(0, 10, 100)
line1, = ax.plot(x, np.sin(x), label='Sine for how2matplotlib.com')
line2, = ax.plot(x, np.cos(x), label='Cosine for how2matplotlib.com')

for i in range(50):
    line1.set_ydata(np.sin(x + i/10.0))
    ax.draw_artist(line1)  # 只更新正弦曲线
    fig.canvas.blit(ax.bbox)
    plt.pause(0.1)

plt.show()
Output:
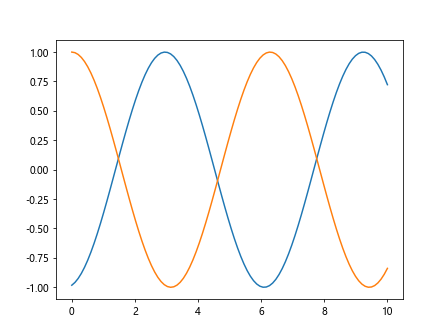
在这个例子中,我们只更新了正弦曲线,而余弦曲线保持不变。这种精细控制在创建复杂的动画或交互式图形时特别有用。
4. draw_artist()的常见应用场景
4.1 实时数据可视化
draw_artist()方法在实时数据可视化中特别有用,例如在显示股票价格、传感器数据或其他实时变化的数据时。
import matplotlib.pyplot as plt
import numpy as np

fig, ax = plt.subplots()
x = np.linspace(0, 10, 100)
line, = ax.plot(x, np.random.rand(100), label='Real-time data for how2matplotlib.com')
ax.set_ylim(0, 1)

for i in range(100):
    line.set_ydata(np.random.rand(100))
    ax.draw_artist(ax.patch)
    ax.draw_artist(line)
    fig.canvas.blit(ax.bbox)
    plt.pause(0.1)

plt.show()
Output:
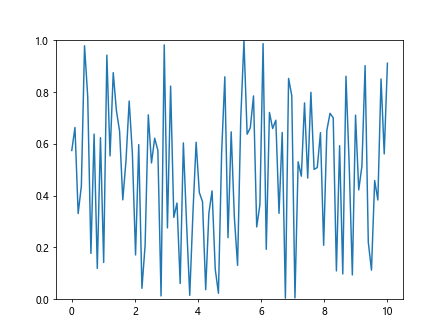
这个例子模拟了实时数据的可视化,每次迭代都更新随机数据。使用draw_artist()可以确保smooth和高效的更新。
4.2 交互式图形
在创建交互式图形时,draw_artist()可以提供更流畅的用户体验。
import matplotlib.pyplot as plt
import numpy as np

fig, ax = plt.subplots()
x = np.linspace(0, 10, 100)
line, = ax.plot(x, np.sin(x), label='Interactive plot for how2matplotlib.com')

def on_mouse_move(event):
    if event.inaxes:
        freq = event.xdata / 5
        line.set_ydata(np.sin(freq * x))
        ax.draw_artist(ax.patch)
        ax.draw_artist(line)
        fig.canvas.blit(ax.bbox)

fig.canvas.mpl_connect('motion_notify_event', on_mouse_move)
plt.show()
Output:
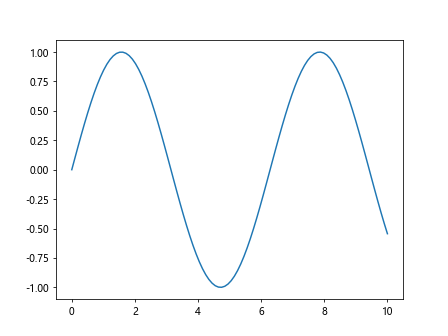
这个交互式图形允许用户通过移动鼠标来改变正弦波的频率。draw_artist()方法确保了图形的平滑更新。
5. draw_artist()的高级用法
5.1 多个艺术家对象的更新
draw_artist()可以用于同时更新多个艺术家对象,这在复杂的图形中特别有用。
import matplotlib.pyplot as plt
import numpy as np

fig, ax = plt.subplots()
x = np.linspace(0, 10, 100)
line1, = ax.plot(x, np.sin(x), label='Sine for how2matplotlib.com')
line2, = ax.plot(x, np.cos(x), label='Cosine for how2matplotlib.com')
text = ax.text(5, 0, 'Phase: 0', ha='center')

for i in range(100):
    phase = i / 10.0
    line1.set_ydata(np.sin(x + phase))
    line2.set_ydata(np.cos(x + phase))
    text.set_text(f'Phase: {phase:.2f}')

    ax.draw_artist(ax.patch)
    ax.draw_artist(line1)
    ax.draw_artist(line2)
    ax.draw_artist(text)
    fig.canvas.blit(ax.bbox)
    plt.pause(0.1)

plt.show()
Output:
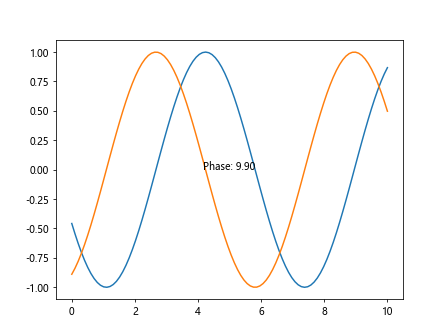
这个例子同时更新了两条线和一个文本对象,展示了draw_artist()在处理多个元素时的灵活性。
5.2 结合背景缓存
为了进一步提高性能,我们可以将draw_artist()与背景缓存结合使用。
import matplotlib.pyplot as plt
import numpy as np

fig, ax = plt.subplots()
x = np.linspace(0, 10, 100)
line, = ax.plot(x, np.sin(x), label='Cached background for how2matplotlib.com')

# 缓存背景
fig.canvas.draw()
background = fig.canvas.copy_from_bbox(ax.bbox)

for i in range(100):
    # 恢复背景
    fig.canvas.restore_region(background)

    # 更新数据
    line.set_ydata(np.sin(x + i/10.0))

    # 重绘线条
    ax.draw_artist(line)

    # 更新画布
    fig.canvas.blit(ax.bbox)
    fig.canvas.flush_events()
    plt.pause(0.1)

plt.show()
Output:
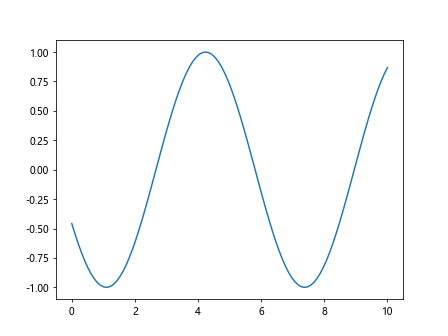
这个例子使用了背景缓存技术,进一步提高了动画的效率。通过保存和恢复背景,我们可以避免重复绘制静态元素。
6. draw_artist()的注意事项和限制
尽管draw_artist()方法非常强大,但在使用时也需要注意一些事项:
- 兼容性:并非所有的后端都完全支持
draw_artist()和blit()操作。在使用前,确保你的Matplotlib配置支持这些功能。 -
复杂性:对于简单的静态图形,使用
draw_artist()可能会增加不必要的复杂性。在这种情况下,传统的绘图方法可能更合适。 -
内存使用:频繁使用
blit()可能会增加内存使用。在处理大型图形或长时间运行的程序时,需要注意内存管理。 -
更新范围:
draw_artist()只更新指定的艺术家对象。如果你的更改影响了其他元素(如轴限制),可能需要额外的步骤来更新整个图形。
import matplotlib.pyplot as plt
import numpy as np

fig, ax = plt.subplots()
x = np.linspace(0, 10, 100)
line, = ax.plot(x, np.sin(x), label='Limitations demo for how2matplotlib.com')

for i in range(100):
    new_data = np.sin(x + i/10.0) * (i/10.0 + 1)
    line.set_ydata(new_data)

    # 更新y轴限制
    ax.set_ylim(np.min(new_data), np.max(new_data))

    # 在这种情况下,我们需要重绘整个轴
    ax.draw_artist(ax.patch)
    ax.draw_artist(line)
    for spine in ax.spines.values():
        ax.draw_artist(spine)
    ax.draw_artist(ax.xaxis)
    ax.draw_artist(ax.yaxis)

    fig.canvas.blit(ax.bbox)
    plt.pause(0.1)

plt.show()
Output:
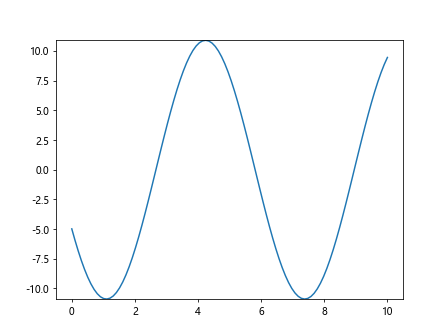
这个例子展示了当需要更新轴限制时,如何使用draw_artist()重绘整个轴。
7. 与其他Matplotlib功能的集成
draw_artist()方法可以与Matplotlib的其他功能无缝集成,增强其实用性。
7.1 结合动画模块
Matplotlib的动画模块提供了一个更结构化的方式来创建动画。我们可以将draw_artist()与FuncAnimation结合使用,以创建高效的动画。
import matplotlib.pyplot as plt
import matplotlib.animation as animation
import numpy as np

fig, ax = plt.subplots()
x = np.linspace(0, 10, 100)
line, = ax.plot(x, np.sin(x), label='Animation for how2matplotlib.com')

def animate(frame):
    line.set_ydata(np.sin(x + frame/10.0))
    ax.draw_artist(ax.patch)
    ax.draw_artist(line)
    return [line]

ani = animation.FuncAnimation(fig, animate, frames=100, interval=50, blit=True)
plt.show()
Output:
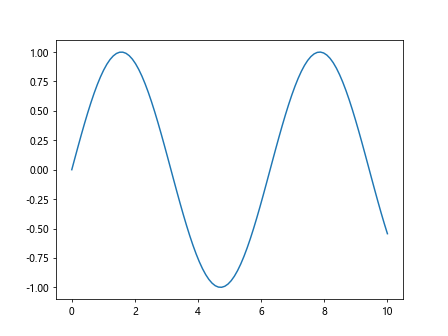
这个例子展示了如何将draw_artist()与FuncAnimation结合使用,创建一个高效的动画。
7.2 在子图中使用
draw_artist()方法也可以在包含多个子图的复杂布局中使用。
import matplotlib.pyplot as plt
import numpy as np

fig, (ax1, ax2) = plt.subplots(2, 1)
x = np.linspace(0, 10, 100)
line1, = ax1.plot(x, np.sin(x), label='Subplot 1 for how2matplotlib.com')
line2, = ax2.plot(x, np.cos(x), label='Subplot 2 for how2matplotlib.com')

for i in range(100):
    line1.set_ydata(np.sin(x + i/10.0))
    line2.set_ydata(np.cos(x + i/10.0))

    ax1.draw_artist(ax1.patch)
    ax1.draw_artist(line1)
    ax2.draw_artist(ax2.patch)
    ax2.draw_artist(line2)

    fig.canvas.blit(ax1.bbox)
    fig.canvas.blit(ax2.bbox)
    plt.pause(0.1)

plt.show()
这个例子展示了如何在具有多个子图的图形中使用draw_artist(),每个子图都可以独立更新。
8. 性能优化技巧
为了充分发挥draw_artist()的性能优势,可以采用一些优化技巧:
8.1 使用blitting
Blitting是一种图形编程技术,可以显著提高动画的性能。它涉及将图形的静态部分保存为背景,然后只更新变化的部分。
import matplotlib.pyplot as plt
import numpy as np

fig, ax = plt.subplots()
x = np.linspace(0, 10, 100)
line, = ax.plot(x, np.sin(x), label='Blitting demo for how2matplotlib.com')

# 保存背景
fig.canvas.draw()
background = fig.canvas.copy_from_bbox(ax.bbox)

for i in range(100):
    # 恢复背景
    fig.canvas.restore_region(background)

    # 更新数据
    line.set_ydata(np.sin(x + i/10.0))

    # 重绘线条
    ax.draw_artist(line)

    # 更新画布
    fig.canvas.blit(ax.bbox)
    fig.canvas.flush_events()
    plt.pause(0.01)

plt.show()
Output:
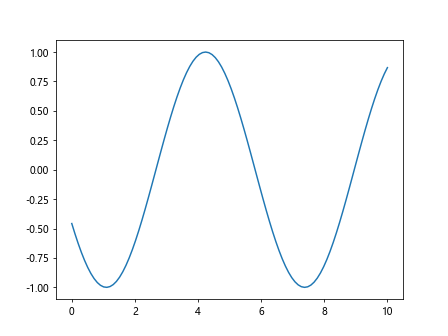
这个例子展示了如何使用blitting技术来优化动画性能。
8.2 最小化重绘区域
通过只重绘必要的区域,可以进一步提高性能。
import matplotlib.pyplot as plt
import numpy as np

fig, ax = plt.subplots()
x = np.linspace(0, 10, 100)
line, = ax.plot(x, np.sin(x), label='Optimized redraw for how2matplotlib.com')

# 获取线条的边界框
line_bbox = line.get_bbox()

for i in range(100):
    line.set_ydata(np.sin(x + i/10.0))

    # 只重绘线条所在的区域
    ax.draw_artist(line)
    fig.canvas.blit(line_bbox)
    plt.pause(0.01)

plt.show()
Output:
这个例子通过只重绘线条所在的区域来优化性能。
9. 调试和故障排除
使用draw_artist()时可能会遇到一些常见问题。以下是一些调试技巧和解决方案:
9.1 检查后端兼容性
不是所有的Matplotlib后端都支持draw_artist()和blitting。可以使用以下代码检查当前后端是否支持这些功能:
import matplotlib.pyplot as plt

fig, ax = plt.subplots()
if hasattr(fig.canvas, 'copy_from_bbox') and hasattr(fig.canvas, 'blit'):
    print("Current backend supports draw_artist() and blitting for how2matplotlib.com")
else:
    print("Current backend does not fully support draw_artist() and blitting")

plt.show()
Output:
9.2 处理图形不更新的问题
有时,使用draw_artist()后图形可能不会立即更新。可以尝试强制刷新画布:
import matplotlib.pyplot as plt
import numpy as np

fig, ax = plt.subplots()
x = np.linspace(0, 10, 100)
line, = ax.plot(x, np.sin(x), label='Troubleshooting for how2matplotlib.com')

for i in range(100):
    line.set_ydata(np.sin(x + i/10.0))
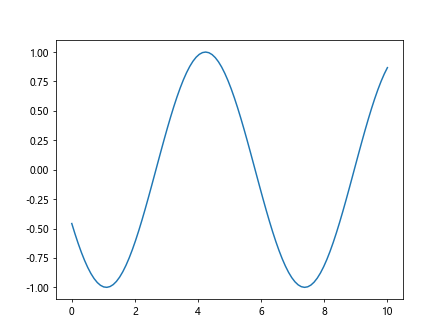
    ax.draw_artist(line)
    fig.canvas.blit(ax.bbox)
    fig.canvas.flush_events()  # 强制刷新画布
    plt.pause(0.01)

plt.show()
Output:
10. 高级应用示例
10.1 创建交互式数据浏览器
使用draw_artist()可以创建高效的交互式数据浏览器。
import matplotlib.pyplot as plt
import numpy as np

class DataBrowser:
    def __init__(self, data):
        self.data = data
        self.fig, self.ax = plt.subplots()
        self.line, = self.ax.plot(data[0], label='Data browser for how2matplotlib.com')
        self.ax.set_ylim(np.min(data), np.max(data))
        self.slider_ax = plt.axes([0.2, 0.02, 0.6, 0.03])
        self.slider = plt.Slider(self.slider_ax, 'Time', 0, len(data)-1, valinit=0, valstep=1)
        self.slider.on_changed(self.update)

        self.fig.canvas.draw()
        self.background = self.fig.canvas.copy_from_bbox(self.ax.bbox)

    def update(self, val):
        i = int(self.slider.val)
        self.line.set_ydata(self.data[i])
        self.fig.canvas.restore_region(self.background)
        self.ax.draw_artist(self.line)
        self.fig.canvas.blit(self.ax.bbox)

# 创建示例数据
data = [np.sin(np.linspace(0, 10, 100) + i/10) for i in range(100)]

browser = DataBrowser(data)
plt.show()
Output:
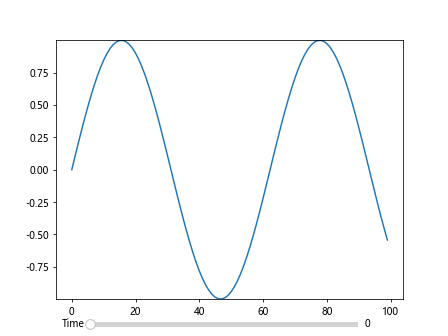
这个例子创建了一个交互式数据浏览器,允许用户通过滑块浏览不同时间点的数据。
10.2 实时数据可视化
draw_artist()方法非常适合用于实时数据可视化,例如模拟传感器数据的实时显示。
import matplotlib.pyplot as plt
import numpy as np
import time

class RealtimeMonitor:
    def __init__(self, max_points=100):
        self.max_points = max_points
        self.fig, self.ax = plt.subplots()
        self.line, = self.ax.plot(np.arange(max_points), np.zeros(max_points), label='Realtime data for how2matplotlib.com')
        self.ax.set_ylim(-1, 1)
        self.ax.set_xlim(0, max_points)
        self.data = np.zeros(max_points)

        self.fig.canvas.draw()
        self.background = self.fig.canvas.copy_from_bbox(self.ax.bbox)

    def update(self, new_data):
        self.data = np.roll(self.data, -1)
        self.data[-1] = new_data
        self.line.set_ydata(self.data)

        self.fig.canvas.restore_region(self.background)
        self.ax.draw_artist(self.line)
        self.fig.canvas.blit(self.ax.bbox)
        self.fig.canvas.flush_events()

monitor = RealtimeMonitor()
plt.show(block=False)

for _ in range(1000):
    new_data = np.random.randn()
    monitor.update(new_data)
    time.sleep(0.05)

plt.close()
这个例子模拟了实时数据监控系统,持续更新和显示最新的数据点。
11. 与其他Python库的集成
draw_artist()方法可以与其他Python库结合使用,以创建更复杂和强大的可视化应用。
11.1 与NumPy的集成
NumPy是Python中用于科学计算的基础库,它与Matplotlib有很好的集成。
import matplotlib.pyplot as plt
import numpy as np

fig, ax = plt.subplots()
x = np.linspace(0, 10, 100)
line, = ax.plot(x, np.sin(x), label='NumPy integration for how2matplotlib.com')

for i in range(100):
    # 使用NumPy进行数据操作
    new_data = np.sin(x + i/10.0) * np.exp(-i/100.0)
    line.set_ydata(new_data)

    ax.draw_artist(ax.patch)
    ax.draw_artist(line)
    fig.canvas.blit(ax.bbox)
    plt.pause(0.05)

plt.show()
Output:
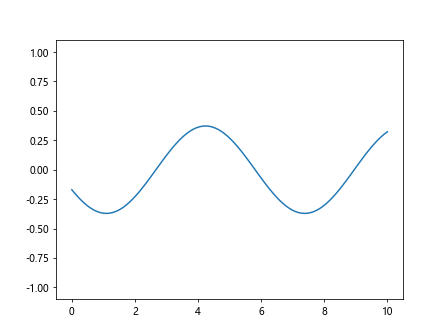
这个例子展示了如何结合NumPy的数学函数和draw_artist()方法创建动态图形。
11.2 与Pandas的集成
Pandas是Python中用于数据分析的强大库,可以与Matplotlib和draw_artist()方法结合使用。
import matplotlib.pyplot as plt
import pandas as pd
import numpy as np

# 创建示例数据
dates = pd.date_range('20230101', periods=100)
df = pd.DataFrame(np.random.randn(100).cumsum(), index=dates, columns=['value'])

fig, ax = plt.subplots()
line, = ax.plot(df.index, df['value'], label='Pandas data for how2matplotlib.com')

ax.set_xlim(df.index.min(), df.index.max())
ax.set_ylim(df['value'].min(), df['value'].max())

for i in range(len(df)):
    line.set_data(df.index[:i+1], df['value'][:i+1])
    ax.draw_artist(ax.patch)
    ax.draw_artist(line)
    fig.canvas.blit(ax.bbox)
    plt.pause(0.05)

plt.show()
Output:
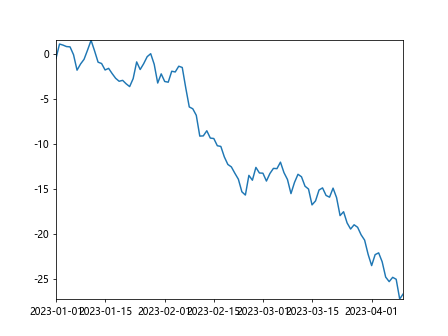
这个例子展示了如何使用draw_artist()方法来动态可视化Pandas DataFrame中的时间序列数据。
12. 总结与最佳实践
Axes.draw_artist()方法是Matplotlib中一个强大的工具,特别适用于创建高效的动画和交互式图形。通过只更新需要变化的图形元素,它可以显著提高绘图性能。以下是使用draw_artist()的一些最佳实践:
- 性能优化:对于需要频繁更新的图形,优先考虑使用
draw_artist()。 -
结合blitting:使用背景缓存和blitting技术可以进一步提高性能。
-
最小化重绘区域:只重绘必要的区域可以优化性能。
-
适当的使用场景:对于简单的静态图形,传统的绘图方法可能更合适。
-
注意兼容性:确保使用的Matplotlib后端支持
draw_artist()和blitting。 -
内存管理:在长时间运行的程序中注意内存使用。
-
与其他库集成:结合NumPy、Pandas等库可以创建更强大的可视化应用。
通过掌握draw_artist()方法,开发者可以创建更高效、更流畅的数据可视化和交互式图形,为用户提供更好的体验。无论是实时数据监控、动态图表还是复杂的交互式应用,draw_artist()都是一个值得掌握的强大工具。
 极客教程
极客教程