Matplotlib绘制两条曲线之间的填充多边形:详细教程与实例
参考:Make filled polygons between two curves in Python using Matplotlib
Matplotlib是Python中强大的数据可视化库,它提供了丰富的绘图功能。本文将详细介绍如何使用Matplotlib在两条曲线之间创建填充多边形,这是一种常用的数据可视化技术,可以直观地展示两个数据集之间的差异或关系。我们将探讨多种方法和技巧,以帮助您掌握这一绘图技能。
1. 基础知识:理解填充多边形
在开始绘制之前,我们需要理解什么是填充多边形,以及为什么它在数据可视化中很重要。
填充多边形是指在两条曲线之间的区域用颜色或图案填充。这种技术通常用于:
- 显示数据范围或不确定性
- 比较两个数据集
- 强调某个特定区域
- 创建面积图
在Matplotlib中,我们主要使用fill_between()函数来实现这一效果。
让我们从一个简单的例子开始:
import matplotlib.pyplot as plt
import numpy as np

x = np.linspace(0, 10, 100)
y1 = np.sin(x)
y2 = np.cos(x)

plt.figure(figsize=(10, 6))
plt.plot(x, y1, label='Sine')
plt.plot(x, y2, label='Cosine')
plt.fill_between(x, y1, y2, alpha=0.3)
plt.title('Filled Area Between Sine and Cosine Curves - how2matplotlib.com')
plt.legend()
plt.show()
Output:
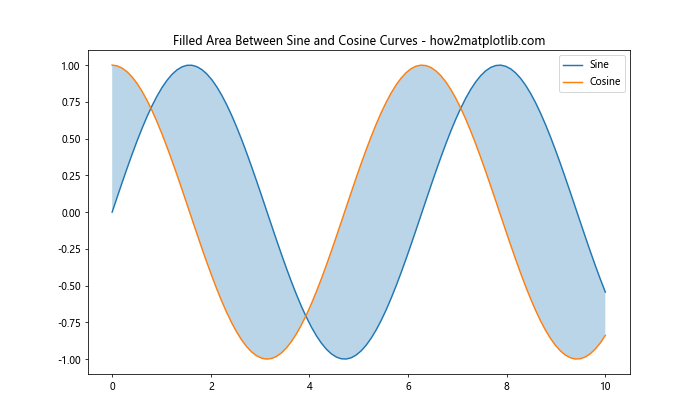
在这个例子中,我们创建了两条曲线(正弦和余弦),然后使用fill_between()函数填充它们之间的区域。alpha参数用于设置填充区域的透明度。
2. 使用fill_between()函数
fill_between()函数是Matplotlib中创建填充多边形的核心工具。让我们深入了解它的用法和参数。
2.1 基本语法
fill_between()函数的基本语法如下:
plt.fill_between(x, y1, y2, where=None, interpolate=False, step=None, **kwargs)
x:x轴数据y1:第一条曲线的y值y2:第二条曲线的y值(可选,默认为0)where:指定填充区域的条件interpolate:是否在数据点之间进行插值step:创建阶梯式填充**kwargs:其他关键字参数,如颜色、透明度等
2.2 填充到x轴
最简单的用法是填充一条曲线到x轴的区域:
import matplotlib.pyplot as plt
import numpy as np

x = np.linspace(0, 10, 100)
y = np.sin(x)

plt.figure(figsize=(10, 6))
plt.plot(x, y, label='Sine')
plt.fill_between(x, y, color='skyblue', alpha=0.4)
plt.title('Area Under Sine Curve - how2matplotlib.com')
plt.legend()
plt.show()
Output:
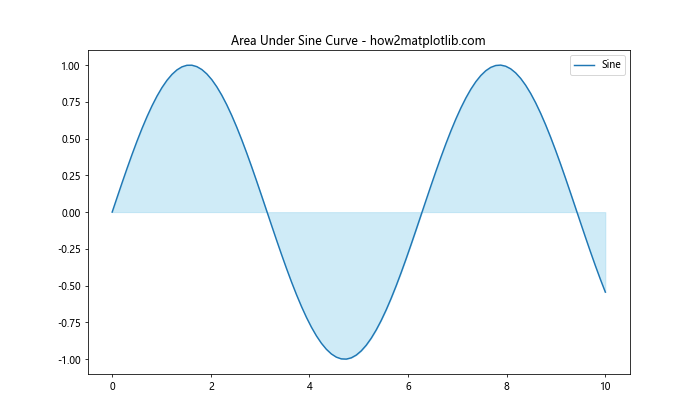
这个例子展示了如何填充正弦曲线下方到x轴的区域。
2.3 填充两条曲线之间的区域
现在,让我们看看如何填充两条曲线之间的区域:
import matplotlib.pyplot as plt
import numpy as np

x = np.linspace(0, 10, 100)
y1 = np.sin(x)
y2 = np.sin(x) * np.exp(-x/10)

plt.figure(figsize=(10, 6))
plt.plot(x, y1, label='Curve 1')
plt.plot(x, y2, label='Curve 2')
plt.fill_between(x, y1, y2, color='green', alpha=0.3)
plt.title('Area Between Two Curves - how2matplotlib.com')
plt.legend()
plt.show()
Output:
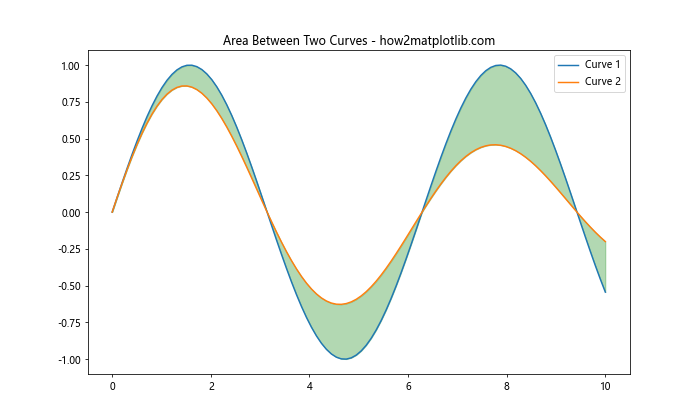
这个例子展示了如何填充两条不同的曲线之间的区域。
3. 条件填充
有时,我们可能只想填充满足某些条件的区域。fill_between()函数的where参数允许我们实现这一点。
3.1 基于y值的条件填充
import matplotlib.pyplot as plt
import numpy as np

x = np.linspace(0, 10, 100)
y1 = np.sin(x)
y2 = np.cos(x)

plt.figure(figsize=(10, 6))
plt.plot(x, y1, label='Sine')
plt.plot(x, y2, label='Cosine')
plt.fill_between(x, y1, y2, where=(y1 > y2), color='red', alpha=0.3, label='Sine > Cosine')
plt.fill_between(x, y1, y2, where=(y1 <= y2), color='blue', alpha=0.3, label='Sine <= Cosine')
plt.title('Conditional Filling - how2matplotlib.com')
plt.legend()
plt.show()
Output:
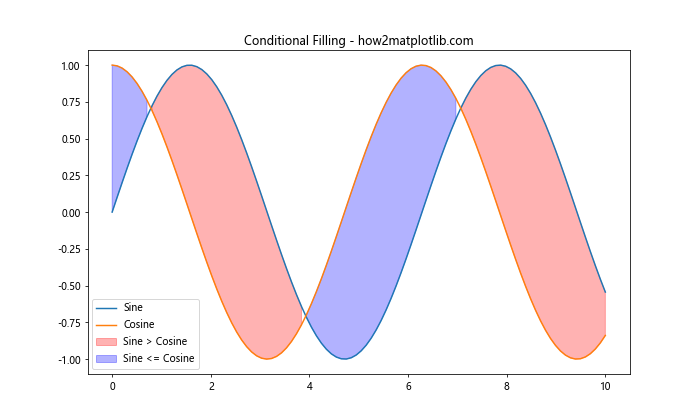
这个例子展示了如何根据y值的大小关系来选择性地填充区域。
3.2 基于x值的条件填充
import matplotlib.pyplot as plt
import numpy as np

x = np.linspace(0, 10, 100)
y = np.sin(x)

plt.figure(figsize=(10, 6))
plt.plot(x, y, label='Sine')
plt.fill_between(x, y, where=(x < 5), color='green', alpha=0.3, label='x < 5')
plt.fill_between(x, y, where=(x >= 5), color='orange', alpha=0.3, label='x >= 5')
plt.title('Filling Based on X Values - how2matplotlib.com')
plt.legend()
plt.show()
Output:
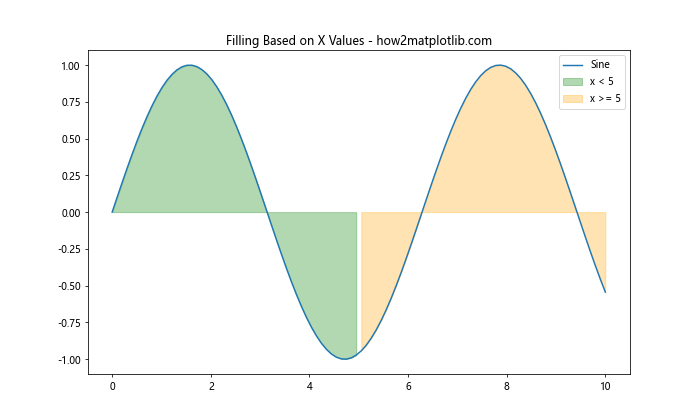
这个例子展示了如何根据x值来选择性地填充区域。
4. 高级技巧
4.1 使用渐变色填充
我们可以使用颜色映射来创建渐变填充效果:
import matplotlib.pyplot as plt
import numpy as np
from matplotlib.colors import LinearSegmentedColormap

x = np.linspace(0, 10, 100)
y1 = np.sin(x)
y2 = np.cos(x)

colors = ['blue', 'white', 'red']
n_bins = 100
cmap = LinearSegmentedColormap.from_list('custom', colors, N=n_bins)

plt.figure(figsize=(10, 6))
plt.plot(x, y1, color='blue', label='Sine')
plt.plot(x, y2, color='red', label='Cosine')

for i in range(n_bins):
    plt.fill_between(x, y1, y2, where=y1 >= y2, color=cmap(i/n_bins), alpha=0.1)
    plt.fill_between(x, y1, y2, where=y1 < y2, color=cmap(1 - i/n_bins), alpha=0.1)

plt.title('Gradient Filling Between Curves - how2matplotlib.com')
plt.legend()
plt.show()
Output:
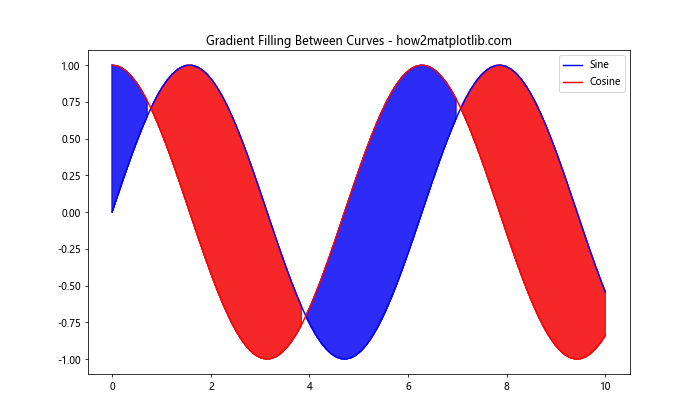
这个例子展示了如何使用颜色映射创建渐变填充效果。
4.2 填充多个区域
有时我们需要在同一图表中填充多个不同的区域:
import matplotlib.pyplot as plt
import numpy as np

x = np.linspace(0, 10, 100)
y1 = np.sin(x)
y2 = np.sin(2*x)
y3 = np.sin(3*x)

plt.figure(figsize=(10, 6))
plt.plot(x, y1, label='Sin(x)')
plt.plot(x, y2, label='Sin(2x)')
plt.plot(x, y3, label='Sin(3x)')

plt.fill_between(x, y1, y2, where=(y1 > y2), color='red', alpha=0.3, label='y1 > y2')
plt.fill_between(x, y2, y3, where=(y2 > y3), color='green', alpha=0.3, label='y2 > y3')
plt.fill_between(x, y1, y3, where=(y1 < y3), color='blue', alpha=0.3, label='y1 < y3')

plt.title('Multiple Filled Areas - how2matplotlib.com')
plt.legend()
plt.show()
Output:
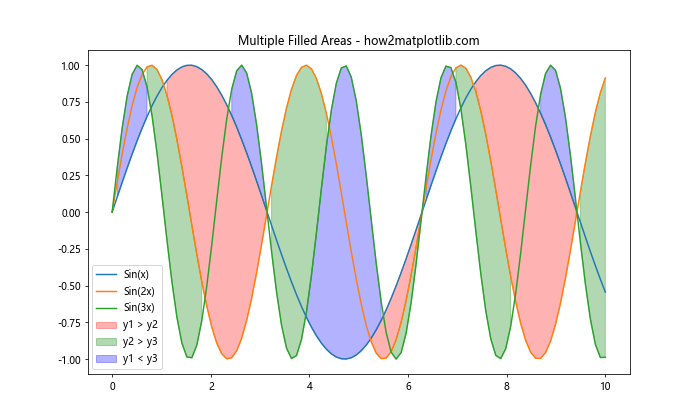
这个例子展示了如何在同一图表中填充多个不同的区域。
4.3 创建堆叠面积图
堆叠面积图是另一种常见的可视化类型,可以使用fill_between()来创建:
import matplotlib.pyplot as plt
import numpy as np

x = np.linspace(0, 10, 100)
y1 = np.random.rand(100)
y2 = np.random.rand(100)
y3 = np.random.rand(100)

plt.figure(figsize=(10, 6))

plt.fill_between(x, 0, y1, label='Dataset 1', alpha=0.5)
plt.fill_between(x, y1, y1+y2, label='Dataset 2', alpha=0.5)
plt.fill_between(x, y1+y2, y1+y2+y3, label='Dataset 3', alpha=0.5)

plt.title('Stacked Area Chart - how2matplotlib.com')
plt.legend()
plt.show()
Output:
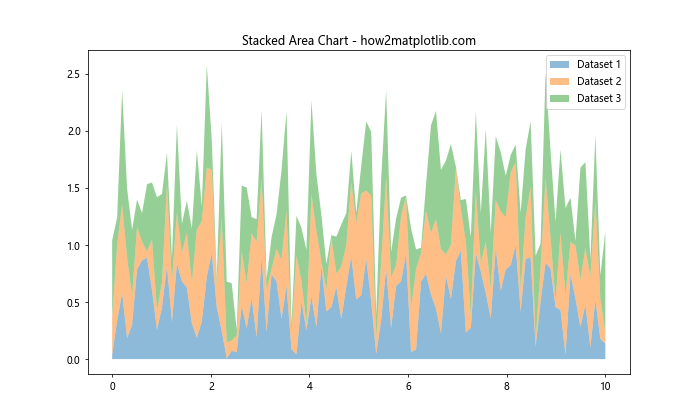
这个例子展示了如何创建一个简单的堆叠面积图。
5. 自定义样式
5.1 使用不同的填充样式
Matplotlib提供了多种填充样式,我们可以使用hatch参数来设置:
import matplotlib.pyplot as plt
import numpy as np

x = np.linspace(0, 10, 100)
y1 = np.sin(x)
y2 = np.cos(x)

plt.figure(figsize=(10, 6))
plt.plot(x, y1, label='Sine')
plt.plot(x, y2, label='Cosine')

plt.fill_between(x, y1, y2, where=(y1 > y2), color='red', alpha=0.3, hatch='/', label='Sine > Cosine')
plt.fill_between(x, y1, y2, where=(y1 <= y2), color='blue', alpha=0.3, hatch='\\', label='Sine <= Cosine')

plt.title('Custom Fill Patterns - how2matplotlib.com')
plt.legend()
plt.show()
Output:
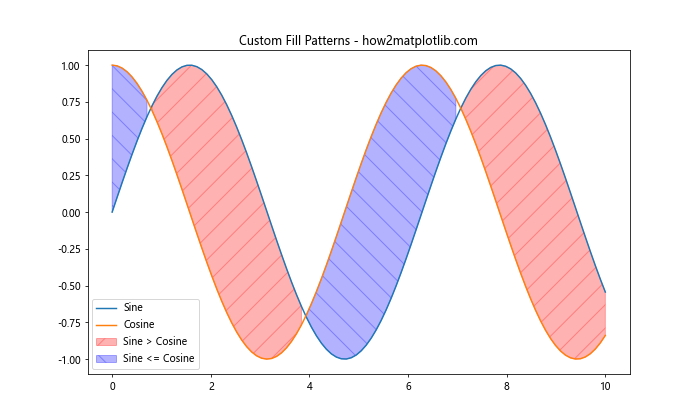
这个例子展示了如何使用不同的填充样式来区分不同的区域。
5.2 添加边框
我们可以为填充区域添加边框以增强视觉效果:
import matplotlib.pyplot as plt
import numpy as np

x = np.linspace(0, 10, 100)
y1 = np.sin(x)
y2 = np.cos(x)

plt.figure(figsize=(10, 6))
plt.plot(x, y1, label='Sine')
plt.plot(x, y2, label='Cosine')

plt.fill_between(x, y1, y2, color='lightblue', alpha=0.5, edgecolor='blue', linewidth=2)

plt.title('Filled Area with Border - how2matplotlib.com')
plt.legend()
plt.show()
Output:
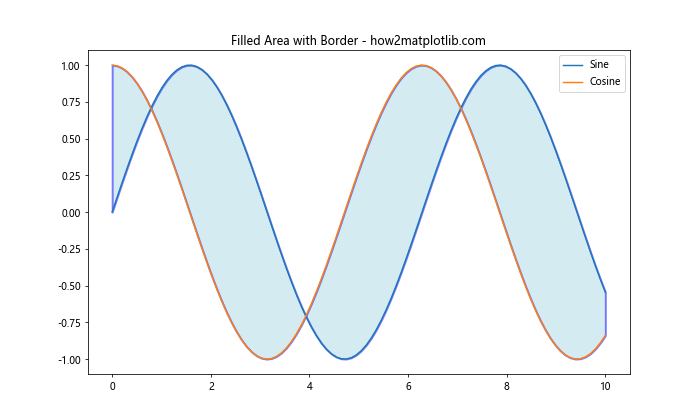
这个例子展示了如何为填充区域添加边框。
6. 实际应用案例
6.1 可视化股票价格范围
import matplotlib.pyplot as plt
import numpy as np

dates = np.arange('2023-01-01', '2023-12-31', dtype='datetime64[D]')
high_prices = np.random.randint(100, 150, size=len(dates))
low_prices = high_prices - np.random.randint(5, 20, size=len(dates))

plt.figure(figsize=(12, 6))
plt.plot(dates, high_prices, label='High Price')
plt.plot(dates, low_prices, label='Low Price')
plt.fill_between(dates, high_prices, low_prices, alpha=0.3, label='Price Range')

plt.title('Stock Price Range Visualization - how2matplotlib.com')
plt.xlabel('Date')
plt.ylabel('Price')
plt.legend()
plt.show()
Output:
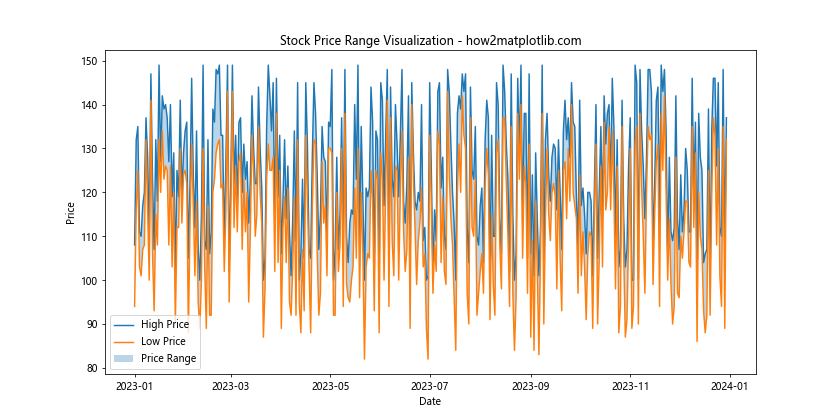
这个例子展示了如何使用填充区域来可视化股票的价格范围。
6.2 可视化置信区间
import matplotlib.pyplot as plt
import numpy as np

x = np.linspace(0, 10, 100)
y = np.sin(x) + np.random.normal(0, 0.1, 100)
y_mean = np.sin(x)
y_std = np.std(y - y_mean)

plt.figure(figsize=(10, 6))
plt.plot(x, y, 'o', alpha=0.5, label='Data')
plt.plot(x, y_mean, label='Mean')
plt.fill_between(x, y_mean - y_std, y_mean + y_std, alpha=0.3, label='Confidence Interval')

plt.title('Data with Confidence Interval - how2matplotlib.com')
plt.legend()
plt.show()
Output:
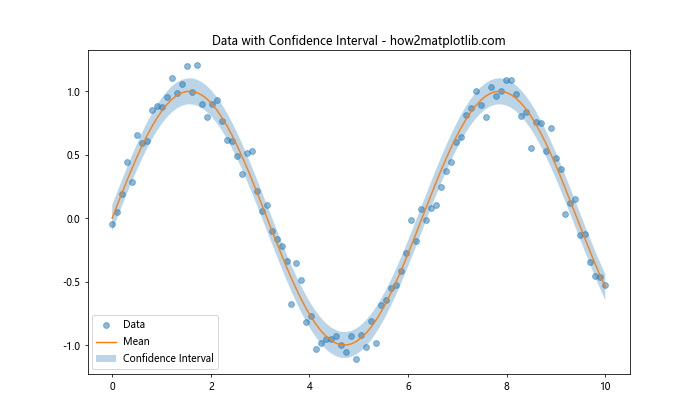
这个例子展示了如何使用填充区域来可视化数据的置信区间。
7. 常见问题和解决方案
7.1 处理不连续数据
有时,我们可能需要处理不连续的数据。在这种情况下,我们可以使用np.nan来表示缺失值:
import matplotlib.pyplot as plt
import numpy as np

x = np.linspace(0, 10, 100)
y1 = np.sin(x)
y2 = np.cos(x)

# 创建一些缺失值
y1[30:40] = np.nan
y2[60:70] = np.nan

plt.figure(figsize=(10, 6))
plt.plot(x, y1, label='Sine')
plt.plot(x, y2, label='Cosine')
plt.fill_between(x, y1, y2, where=~(np.isnan(y1) | np.isnan(y2)), interpolate=True, alpha=0.3)

plt.title('Handling Discontinuous Data - how2matplotlib.com')
plt.legend()
plt.show()
Output:
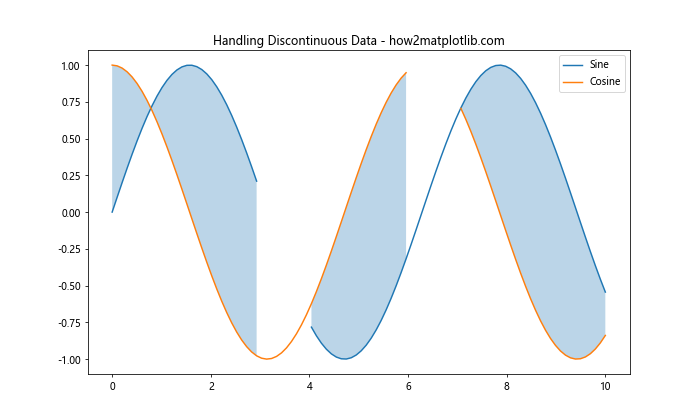
这个例子展示了如何处理包含缺失值的不连续数据。我们使用where参数来排除缺失值,并使用interpolate=True来连接缺失区域。
7.2 处理大量数据
当处理大量数据时,绘图可能会变得很慢。一种解决方案是使用降采样:
import matplotlib.pyplot as plt
import numpy as np

# 生成大量数据
x = np.linspace(0, 100, 10000)
y1 = np.sin(x) + np.random.normal(0, 0.1, 10000)
y2 = np.cos(x) + np.random.normal(0, 0.1, 10000)

# 降采样
step = 100
x_sampled = x[::step]
y1_sampled = y1[::step]
y2_sampled = y2[::step]

plt.figure(figsize=(10, 6))
plt.plot(x_sampled, y1_sampled, label='Sine')
plt.plot(x_sampled, y2_sampled, label='Cosine')
plt.fill_between(x_sampled, y1_sampled, y2_sampled, alpha=0.3)

plt.title('Handling Large Datasets - how2matplotlib.com')
plt.legend()
plt.show()
Output:
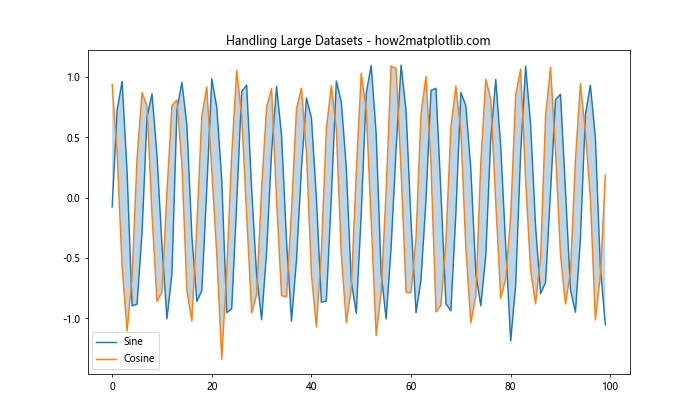
这个例子展示了如何通过降采样来处理大量数据,从而提高绘图效率。
8. 高级应用:动态填充
我们可以创建动态填充效果,例如随时间变化的填充区域:
import matplotlib.pyplot as plt
import numpy as np
from matplotlib.animation import FuncAnimation

fig, ax = plt.subplots(figsize=(10, 6))
x = np.linspace(0, 2*np.pi, 100)
line, = ax.plot([], [], lw=2)
fill = ax.fill_between([], [], alpha=0.3)

ax.set_xlim(0, 2*np.pi)
ax.set_ylim(-1.5, 1.5)

def init():
    line.set_data([], [])
    fill.set_xy(np.empty((0, 2)))
    return line, fill

def update(frame):
    y = np.sin(x + frame/10)
    line.set_data(x, y)

    vertices = np.vstack([np.column_stack([x, y]),
                          np.column_stack([x[::-1], np.zeros_like(x)])])
    fill.set_xy(vertices)

    ax.set_title(f'Dynamic Filling - Frame {frame} - how2matplotlib.com')
    return line, fill

ani = FuncAnimation(fig, update, frames=100, init_func=init, blit=True)
plt.show()
这个例子创建了一个动画,展示了如何实现动态填充效果。
9. 结合其他Matplotlib功能
9.1 添加颜色条
我们可以结合颜色条来展示填充区域的数值范围:
import matplotlib.pyplot as plt
import numpy as np

x = np.linspace(0, 10, 100)
y1 = np.sin(x)
y2 = np.cos(x)

fig, ax = plt.subplots(figsize=(10, 6))
im = ax.fill_between(x, y1, y2, cmap='viridis')
ax.plot(x, y1, 'b', label='Sine')
ax.plot(x, y2, 'r', label='Cosine')

plt.colorbar(im, ax=ax, label='Value')
ax.set_title('Filled Area with Colorbar - how2matplotlib.com')
ax.legend()
plt.show()
Output:
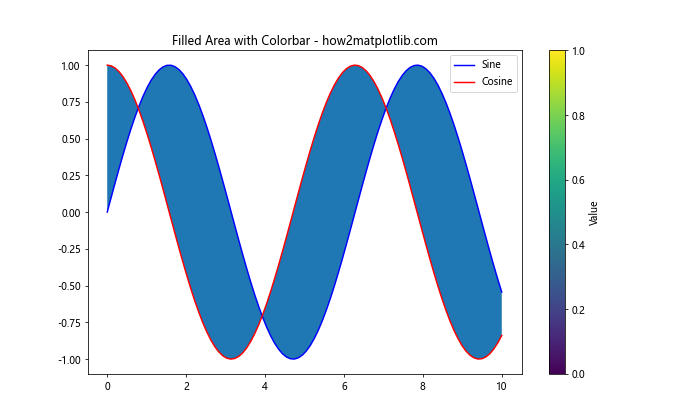
这个例子展示了如何为填充区域添加颜色条,以显示数值范围。
9.2 在3D图中填充
我们也可以在3D图中创建填充效果:
import matplotlib.pyplot as plt
import numpy as np
from mpl_toolkits.mplot3d import Axes3D

fig = plt.figure(figsize=(10, 6))
ax = fig.add_subplot(111, projection='3d')

x = np.linspace(-5, 5, 100)
y = np.linspace(-5, 5, 100)
X, Y = np.meshgrid(x, y)
Z1 = np.sin(np.sqrt(X**2 + Y**2))
Z2 = np.cos(np.sqrt(X**2 + Y**2))

ax.plot_surface(X, Y, Z1, alpha=0.5, cmap='viridis')
ax.plot_surface(X, Y, Z2, alpha=0.5, cmap='plasma')

ax.set_title('3D Filled Surfaces - how2matplotlib.com')
plt.show()
Output:
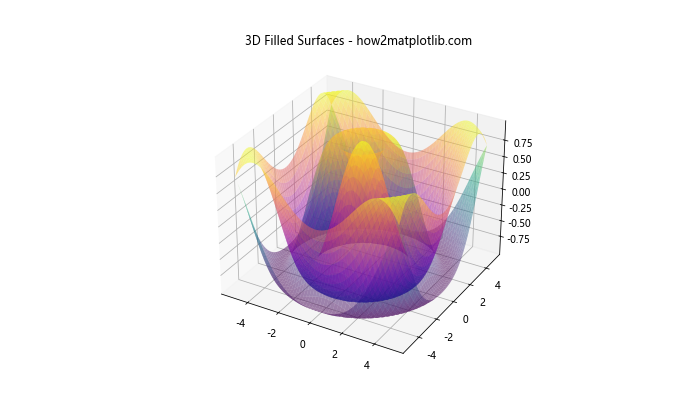
这个例子展示了如何在3D图中创建填充效果,使用两个不同的曲面。
10. 总结
在本文中,我们详细探讨了如何使用Matplotlib在Python中创建两条曲线之间的填充多边形。我们从基础知识开始,逐步深入到更高级的技巧和应用。通过各种示例,我们展示了fill_between()函数的强大功能,以及如何将其应用于各种数据可视化场景。
关键点总结:
- 使用
fill_between()函数是创建填充多边形的核心方法。 - 可以通过条件填充来突出显示特定区域。
- 高级技巧包括使用渐变色填充、创建堆叠面积图等。
- 自定义样式可以通过设置颜色、透明度、填充模式等来实现。
- 实际应用包括股票价格范围可视化、置信区间展示等。
- 处理大量数据时,可以考虑使用降采样技术。
- 动态填充效果可以通过动画实现。
- Matplotlib的其他功能(如颜色条、3D绘图)可以与填充多边形结合使用。
通过掌握这些技巧,您可以创建更加丰富和信息量大的数据可视化图表。记住,实践是提高技能的最佳方式,所以请尝试修改这些示例,创建适合您自己数据和需求的可视化效果。
 极客教程
极客教程