Matplotlib中的Axes.findobj()方法:高效查找图形对象
参考:Matplotlib.axes.Axes.findobj() in Python
Matplotlib是Python中最流行的数据可视化库之一,它提供了丰富的绘图功能和灵活的API。在Matplotlib中,Axes.findobj()方法是一个强大而有用的工具,它允许用户在图形中搜索和定位特定的对象。本文将深入探讨Axes.findobj()方法的用法、特性和应用场景,帮助读者更好地理解和使用这个功能。
1. Axes.findobj()方法简介
Axes.findobj()是Matplotlib中Axes类的一个方法,用于在给定的轴(Axes)对象中查找满足特定条件的图形对象。这个方法可以帮助用户快速定位和操作图形中的特定元素,如线条、文本、标记等。
1.1 基本语法
Axes.findobj()方法的基本语法如下:
Axes.findobj(match=None, include_self=True)
参数说明:
– match:可选参数,用于指定匹配条件。可以是一个类、一个属性名称,或者一个返回布尔值的函数。
– include_self:布尔值,默认为True。指定是否包括Axes对象本身在搜索结果中。
1.2 返回值
Axes.findobj()方法返回一个包含所有匹配对象的列表。
2. 使用Axes.findobj()查找特定类型的对象
一个常见的用例是查找特定类型的图形对象,如线条、文本或标记。
2.1 查找所有线条对象
import matplotlib.pyplot as plt
import numpy as np

fig, ax = plt.subplots()
x = np.linspace(0, 10, 100)
line1 = ax.plot(x, np.sin(x), label='Sin')
line2 = ax.plot(x, np.cos(x), label='Cos')
ax.set_title('how2matplotlib.com - Sine and Cosine')

# 查找所有线条对象
lines = ax.findobj(plt.Line2D)
print(f"Found {len(lines)} Line2D objects")

plt.show()
Output:
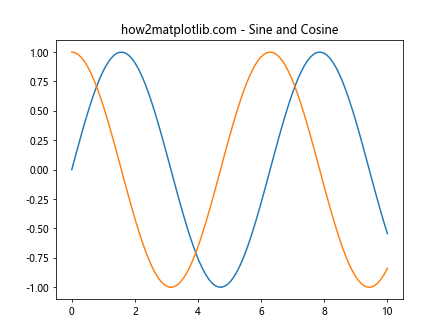
在这个例子中,我们创建了一个包含两条线的图形,然后使用ax.findobj(plt.Line2D)来查找所有的Line2D对象。这将返回一个包含两个线条对象的列表。
2.2 查找所有文本对象
import matplotlib.pyplot as plt

fig, ax = plt.subplots()
ax.text(0.5, 0.5, 'how2matplotlib.com', ha='center', va='center')
ax.set_title('Text Example')

# 查找所有文本对象
texts = ax.findobj(plt.Text)
print(f"Found {len(texts)} Text objects")

plt.show()
Output:
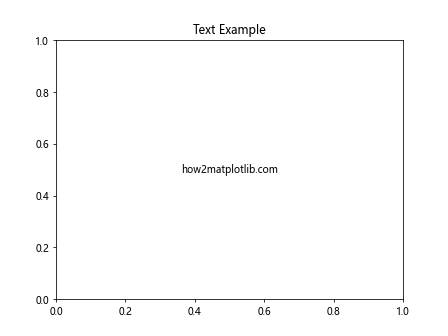
这个例子展示了如何使用ax.findobj(plt.Text)来查找图中的所有文本对象,包括我们添加的文本和标题。
3. 使用自定义条件进行查找
Axes.findobj()方法的强大之处在于它可以接受自定义的匹配条件,使得搜索更加灵活。
3.1 使用lambda函数作为匹配条件
import matplotlib.pyplot as plt
import numpy as np

fig, ax = plt.subplots()
x = np.linspace(0, 10, 100)
ax.plot(x, np.sin(x), color='red', label='Sin')
ax.plot(x, np.cos(x), color='blue', label='Cos')
ax.set_title('how2matplotlib.com - Custom Search')

# 查找所有红色的线条
red_lines = ax.findobj(lambda obj: isinstance(obj, plt.Line2D) and obj.get_color() == 'red')
print(f"Found {len(red_lines)} red lines")

plt.show()
Output:
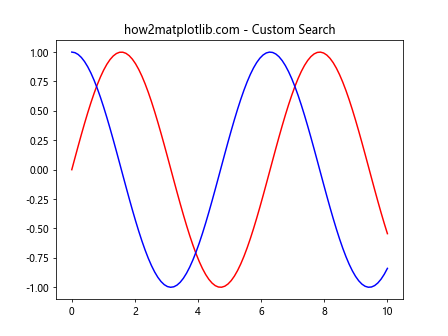
在这个例子中,我们使用lambda函数作为匹配条件,查找所有红色的线条对象。这个lambda函数检查对象是否是Line2D类型,并且颜色是红色。
3.2 使用属性名称作为匹配条件
import matplotlib.pyplot as plt
import numpy as np

fig, ax = plt.subplots()
x = np.linspace(0, 10, 100)
ax.plot(x, np.sin(x), linestyle='--', label='Sin')
ax.plot(x, np.cos(x), linestyle='-', label='Cos')
ax.set_title('how2matplotlib.com - Attribute Search')

# 查找所有虚线
dashed_lines = ax.findobj(linestyle='--')
print(f"Found {len(dashed_lines)} dashed lines")

plt.show()
这个例子展示了如何使用属性名称作为匹配条件。我们查找所有具有虚线样式的线条对象。
4. 在查找结果上执行操作
找到对象后,我们可以对这些对象执行各种操作,如修改属性或应用变换。
4.1 修改找到的对象的属性
import matplotlib.pyplot as plt
import numpy as np

fig, ax = plt.subplots()
x = np.linspace(0, 10, 100)
ax.plot(x, np.sin(x), label='Sin')
ax.plot(x, np.cos(x), label='Cos')
ax.set_title('how2matplotlib.com - Modifying Found Objects')

# 查找所有线条并修改其线宽
lines = ax.findobj(plt.Line2D)
for line in lines:
    line.set_linewidth(3)

plt.show()
Output:
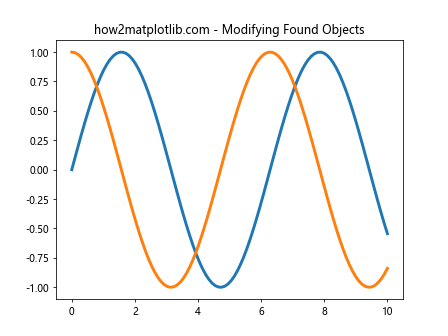
在这个例子中,我们找到所有的线条对象,然后将它们的线宽都设置为3。
4.2 对找到的对象应用变换
import matplotlib.pyplot as plt
import numpy as np
from matplotlib.transforms import Affine2D

fig, ax = plt.subplots()
x = np.linspace(0, 10, 100)
ax.plot(x, np.sin(x), label='Sin')
ax.set_title('how2matplotlib.com - Transforming Found Objects')

# 查找所有线条并应用变换
lines = ax.findobj(plt.Line2D)
for line in lines:
    transform = Affine2D().scale(1, 2) + line.get_transform()
    line.set_transform(transform)

plt.show()
Output:
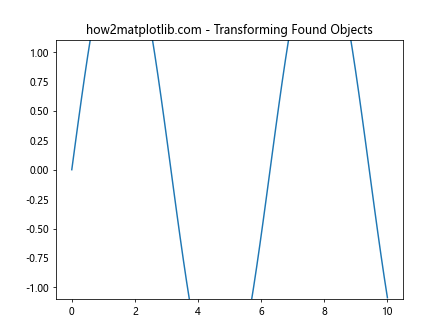
这个例子展示了如何对找到的线条对象应用仿射变换,将其在y方向上缩放2倍。
5. 高级应用:组合多个条件
我们可以组合多个条件来进行更复杂的搜索。
5.1 使用逻辑运算符组合条件
import matplotlib.pyplot as plt
import numpy as np

fig, ax = plt.subplots()
x = np.linspace(0, 10, 100)
ax.plot(x, np.sin(x), color='red', linestyle='--', label='Sin')
ax.plot(x, np.cos(x), color='blue', linestyle='-', label='Cos')
ax.set_title('how2matplotlib.com - Combined Conditions')

# 查找红色或虚线的线条
red_or_dashed = ax.findobj(lambda obj: isinstance(obj, plt.Line2D) and
                           (obj.get_color() == 'red' or obj.get_linestyle() == '--'))
print(f"Found {len(red_or_dashed)} red or dashed lines")

plt.show()
Output:
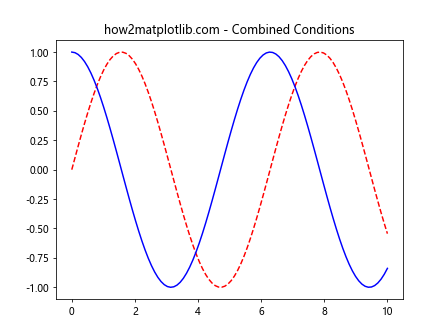
这个例子展示了如何使用逻辑运算符组合多个条件,查找红色或虚线的线条对象。
5.2 使用自定义函数进行复杂匹配
import matplotlib.pyplot as plt
import numpy as np

def custom_match(obj):
    if isinstance(obj, plt.Line2D):
        return obj.get_linewidth() > 1 and obj.get_alpha() is not None
    return False

fig, ax = plt.subplots()
x = np.linspace(0, 10, 100)
ax.plot(x, np.sin(x), linewidth=2, alpha=0.5, label='Sin')
ax.plot(x, np.cos(x), linewidth=1, label='Cos')
ax.set_title('how2matplotlib.com - Custom Matching Function')

# 使用自定义函数查找对象
matched_objects = ax.findobj(custom_match)
print(f"Found {len(matched_objects)} objects matching custom criteria")

plt.show()
Output:
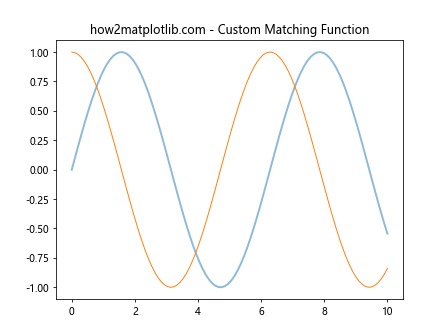
在这个例子中,我们定义了一个自定义函数custom_match,用于查找线宽大于1且具有透明度的线条对象。
6. 在子图中使用findobj()
findobj()方法不仅可以在单个Axes对象上使用,还可以在包含多个子图的Figure对象上使用。
6.1 在整个Figure中查找对象
import matplotlib.pyplot as plt
import numpy as np

fig, (ax1, ax2) = plt.subplots(1, 2, figsize=(10, 4))
x = np.linspace(0, 10, 100)
ax1.plot(x, np.sin(x), label='Sin')
ax2.plot(x, np.cos(x), label='Cos')
fig.suptitle('how2matplotlib.com - Finding Objects in Subplots')

# 在整个Figure中查找所有线条对象
all_lines = fig.findobj(plt.Line2D)
print(f"Found {len(all_lines)} Line2D objects in the entire figure")

plt.show()
Output:
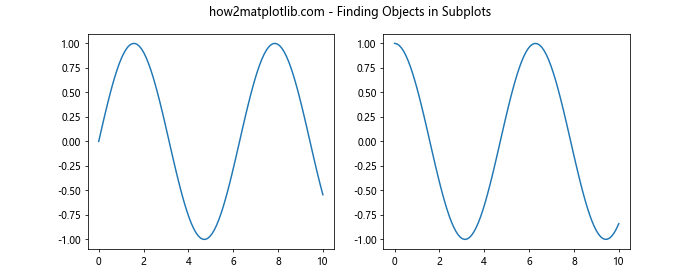
这个例子展示了如何在包含多个子图的Figure对象上使用findobj()方法,查找所有的线条对象。
6.2 在特定子图中查找对象
import matplotlib.pyplot as plt
import numpy as np

fig, (ax1, ax2) = plt.subplots(1, 2, figsize=(10, 4))
x = np.linspace(0, 10, 100)
ax1.plot(x, np.sin(x), color='red', label='Sin')
ax2.plot(x, np.cos(x), color='blue', label='Cos')
fig.suptitle('how2matplotlib.com - Finding Objects in Specific Subplot')

# 在第一个子图中查找红色线条
red_lines_in_ax1 = ax1.findobj(lambda obj: isinstance(obj, plt.Line2D) and obj.get_color() == 'red')
print(f"Found {len(red_lines_in_ax1)} red lines in the first subplot")

plt.show()
Output:
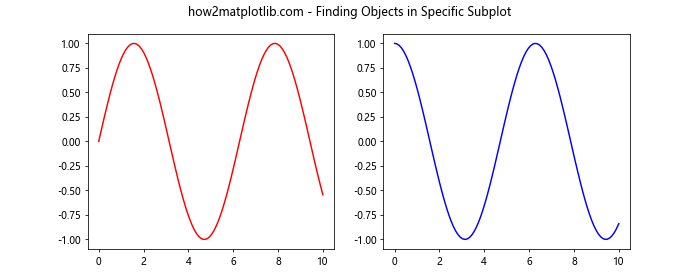
这个例子展示了如何在特定的子图中查找满足条件的对象,在这里我们查找第一个子图中的红色线条。
7. 使用findobj()进行动态图形更新
findobj()方法在创建动态或交互式图形时特别有用,因为它允许我们轻松地找到并更新特定的图形元素。
7.1 动态更新线条颜色
import matplotlib.pyplot as plt
import numpy as np

fig, ax = plt.subplots()
x = np.linspace(0, 10, 100)
line, = ax.plot(x, np.sin(x), label='Sin')
ax.set_title('how2matplotlib.com - Dynamic Color Update')

colors = ['red', 'green', 'blue', 'purple']
for color in colors:
    line, = ax.findobj(plt.Line2D)[0]
    line.set_color(color)
    plt.pause(1)

plt.show()
这个例子展示了如何使用findobj()方法找到线条对象,并动态地更新其颜色。
7.2 动态添加和删除对象
import matplotlib.pyplot as plt
import numpy as np

fig, ax = plt.subplots()
ax.set_xlim(0, 10)
ax.set_ylim(-1, 1)
ax.set_title('how2matplotlib.com - Dynamic Object Addition and Removal')

x = np.linspace(0, 10, 100)
for i in range(5):
    line, = ax.plot(x, np.sin(x + i), label=f'Sin {i}')
    plt.pause(1)

    # 删除最早添加的线
    if i > 1:
        oldest_line = ax.findobj(plt.Line2D)[0]
        oldest_line.remove()

    ax.legend()
    plt.pause(1)

plt.show()
Output:
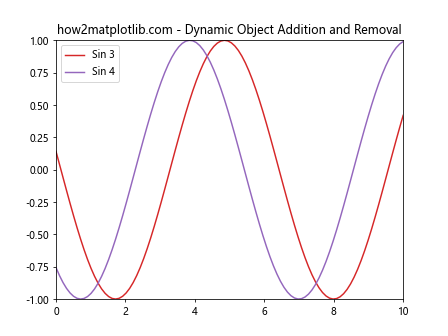
这个例子展示了如何使用findobj()方法在动态图形中添加新的线条,并删除最早添加的线条。
8. 在3D图形中使用findobj()
findobj()方法同样适用于3D图形,可以用来查找和操作3D图形中的对象。
8.1 在3D散点图中查找特定点
import matplotlib.pyplot as plt
import numpy as np

fig = plt.figure()
ax = fig.add_subplot(111, projection='3d')

# 生成随机数据
n = 100
xs = np.random.rand(n)
ys = np.random.rand(n)
zs = np.random.rand(n)
colors = ['red' if x + y + z > 1.5 else 'blue' for x, y, z in zip(xs, ys, zs)]

scatter = ax.scatter(xs, ys, zs, c=colors)
ax.set_title('how2matplotlib.com - 3D Scatter Plot')

# 查找红色的点
red_points = ax.findobj(lambda obj: isinstance(obj, plt.PathCollection) and 'red' in obj.get_facecolors())
print(f"Found {len(red_points)} red point collections")

plt.show()
这个例子展示了如何在3D散点图中使用findobj()方法查找特定颜色的点集合。
8.2 在3D表面图中查找和修改对象
import matplotlib.pyplot as plt
import numpy as np
from mpl_toolkits.mplot3d import Axes3D

fig = plt.figure()
ax = fig.add_subplot(111, projection='3d')

# 生成数据
X = np.arange(-5, 5, 0.25)
Y = np.arange(-5, 5, 0.25)
X, Y = np.meshgrid(X, Y)
R = np.sqrt(X**2 + Y**2)
Z = np.sin(R)

# 绘制表面
surf = ax.plot_surface(X, Y, Z, cmap='viridis')
ax.set_title('how2matplotlib.com - 3D Surface Plot')

# 查找并修改表面对象
surfaces = ax.findobj(lambda obj: isinstance(obj, plt.cm.ScalarMappable))
for surface in surfaces:
    surface.set_cmap('coolwarm')

plt.show()
Output:
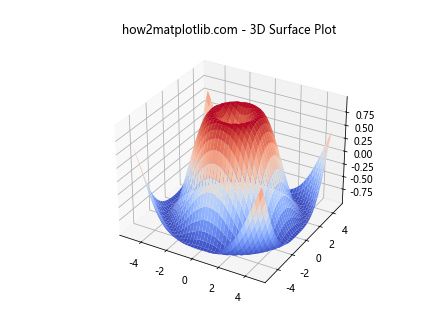
这个例子展示了如何在3D表面图中使用findobj()方法查找表面对象,并修改其颜色映射。
9. 使用findobj()进行图形元素的批量操作
findobj()方法非常适合进行图形元素的批量操作,可以大大提高图形处理的效率。
9.1 批量修改线条样式
import matplotlib.pyplot as plt
import numpy as np

fig, ax = plt.subplots()
x = np.linspace(0, 10, 100)
for i in range(5):
    ax.plot(x, np.sin(x + i), label=f'Sin {i}')
ax.set_title('how2matplotlib.com - Batch Line Style Modification')

# 批量修改所有线条的样式
lines = ax.findobj(plt.Line2D)
for i, line in enumerate(lines):
    line.set_linestyle(['--', '-.', ':', '-'][i % 4])
    line.set_linewidth(2)

ax.legend()
plt.show()
Output:
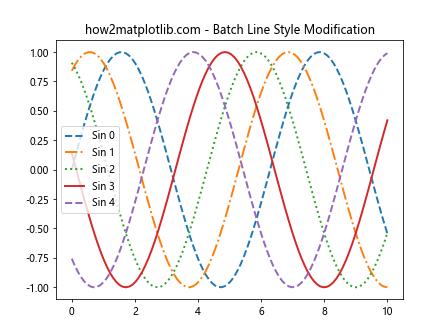
这个例子展示了如何使用findobj()方法找到所有线条,并批量修改它们的样式和线宽。
9.2 批量修改文本属性
import matplotlib.pyplot as plt
import numpy as np

fig, ax = plt.subplots()
x = np.linspace(0, 10, 5)
y = np.random.rand(5)
ax.bar(x, y)
for i, (xi, yi) in enumerate(zip(x, y)):
    ax.text(xi, yi, f'Value: {yi:.2f}', ha='center', va='bottom')
ax.set_title('how2matplotlib.com - Batch Text Modification')

# 批量修改所有文本的属性
texts = ax.findobj(plt.Text)
for text in texts:
    if text != ax.title:
        text.set_fontsize(10)
        text.set_rotation(45)
        text.set_color('red')

plt.show()
Output:
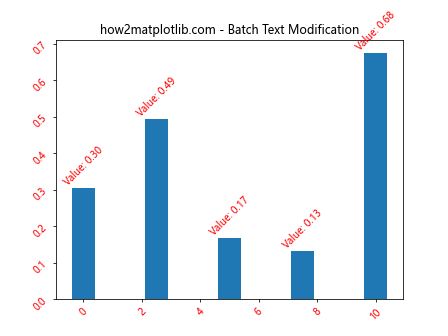
这个例子展示了如何使用findobj()方法找到所有文本对象(除了标题),并批量修改它们的字体大小、旋转角度和颜色。
10. 使用findobj()进行图形元素的选择性操作
有时我们可能只想操作满足特定条件的图形元素,findobj()方法可以帮助我们轻松实现这一目标。
10.1 选择性隐藏图例项
import matplotlib.pyplot as plt
import numpy as np

fig, ax = plt.subplots()
x = np.linspace(0, 10, 100)
for i in range(5):
    ax.plot(x, np.sin(x + i), label=f'Sin {i}')
ax.set_title('how2matplotlib.com - Selective Legend Item Hiding')
ax.legend()

# 选择性隐藏图例项
lines = ax.findobj(plt.Line2D)
for i, line in enumerate(lines):
    if i % 2 == 0:  # 隐藏偶数索引的线条
        line.set_visible(False)
        legend = ax.get_legend()
        legend.get_texts()[i].set_visible(False)

plt.show()
这个例子展示了如何使用findobj()方法选择性地隐藏某些线条及其对应的图例项。
10.2 选择性突出显示数据点
import matplotlib.pyplot as plt
import numpy as np

fig, ax = plt.subplots()
x = np.linspace(0, 10, 50)
y = np.sin(x)
ax.plot(x, y, 'o-', label='Sin')
ax.set_title('how2matplotlib.com - Selective Data Point Highlighting')

# 选择性突出显示数据点
points = ax.findobj(lambda obj: isinstance(obj, plt.Line2D) and obj.get_marker() == 'o')
for point in points:
    xdata, ydata = point.get_data()
    for i, (xi, yi) in enumerate(zip(xdata, ydata)):
        if yi > 0.8:  # 突出显示y值大于0.8的点
            ax.plot(xi, yi, 'ro', markersize=10, alpha=0.5)

ax.legend()
plt.show()
Output:
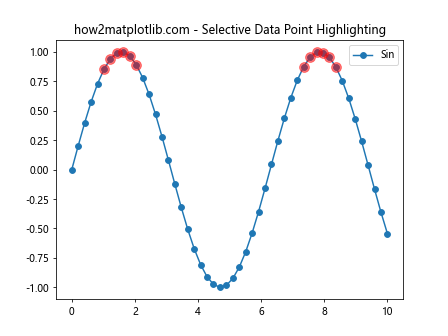
这个例子展示了如何使用findobj()方法找到所有数据点,然后选择性地突出显示满足特定条件的点。
11. 在动画中使用findobj()
findobj()方法在创建动画时也非常有用,可以帮助我们轻松更新特定的图形元素。
11.1 创建简单的动画
import matplotlib.pyplot as plt
import numpy as np
from matplotlib.animation import FuncAnimation

fig, ax = plt.subplots()
x = np.linspace(0, 2*np.pi, 100)
line, = ax.plot(x, np.sin(x))
ax.set_title('how2matplotlib.com - Simple Animation')

def update(frame):
    line, = ax.findobj(plt.Line2D)[0]
    line.set_ydata(np.sin(x + frame/10))
    return line,

ani = FuncAnimation(fig, update, frames=100, interval=50, blit=True)
plt.show()
这个例子展示了如何在动画更新函数中使用findobj()方法找到要更新的线条对象。
11.2 创建多对象动画
import matplotlib.pyplot as plt
import numpy as np
from matplotlib.animation import FuncAnimation

fig, ax = plt.subplots()
x = np.linspace(0, 2*np.pi, 100)
line1, = ax.plot(x, np.sin(x), label='Sin')
line2, = ax.plot(x, np.cos(x), label='Cos')
ax.set_title('how2matplotlib.com - Multi-object Animation')
ax.legend()

def update(frame):
    lines = ax.findobj(plt.Line2D)
    lines[0].set_ydata(np.sin(x + frame/10))
    lines[1].set_ydata(np.cos(x + frame/10))
    return lines

ani = FuncAnimation(fig, update, frames=100, interval=50, blit=True)
plt.show()
Output:
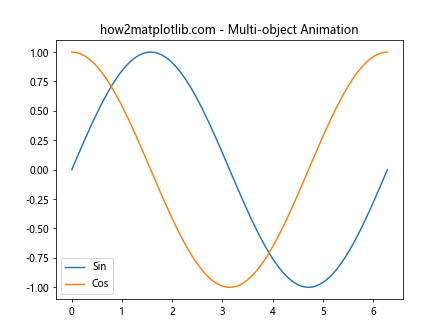
这个例子展示了如何在动画中使用findobj()方法同时更新多个对象。
12. 使用findobj()进行图形分析
除了修改图形元素,findobj()方法还可以用于分析图形中的对象,提取有用的信息。
12.1 分析线条属性
import matplotlib.pyplot as plt
import numpy as np

fig, ax = plt.subplots()
x = np.linspace(0, 10, 100)
ax.plot(x, np.sin(x), color='red', linestyle='--', label='Sin')
ax.plot(x, np.cos(x), color='blue', linestyle='-', label='Cos')
ax.set_title('how2matplotlib.com - Line Property Analysis')

# 分析线条属性
lines = ax.findobj(plt.Line2D)
for i, line in enumerate(lines):
    print(f"Line {i+1}:")
    print(f"  Color: {line.get_color()}")
    print(f"  Linestyle: {line.get_linestyle()}")
    print(f"  Label: {line.get_label()}")

plt.show()
Output:
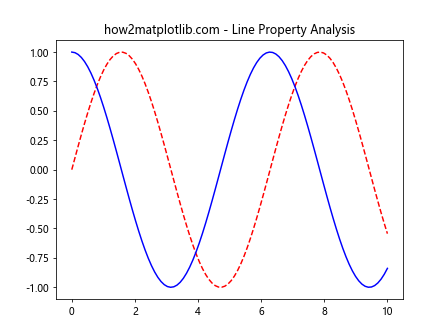
这个例子展示了如何使用findobj()方法找到所有线条对象,并分析它们的属性。
12.2 统计图形元素
import matplotlib.pyplot as plt
import numpy as np

fig, ax = plt.subplots()
x = np.linspace(0, 10, 100)
ax.plot(x, np.sin(x), label='Sin')
ax.plot(x, np.cos(x), label='Cos')
ax.set_title('how2matplotlib.com - Element Statistics')
ax.legend()

# 统计图形元素
lines = ax.findobj(plt.Line2D)
texts = ax.findobj(plt.Text)
patches = ax.findobj(plt.Patch)

print(f"Number of lines: {len(lines)}")
print(f"Number of text elements: {len(texts)}")
print(f"Number of patches: {len(patches)}")

plt.show()
这个例子展示了如何使用findobj()方法统计图形中不同类型元素的数量。
结论
Matplotlib的Axes.findobj()方法是一个强大而灵活的工具,可以帮助用户在复杂的图形中快速定位和操作特定的对象。通过本文的详细介绍和丰富的示例,我们展示了findobj()方法在各种场景下的应用,包括基本查找、条件筛选、批量操作、动态更新和图形分析等。掌握这个方法可以大大提高图形处理的效率和灵活性,使得Matplotlib的使用更加得心应手。无论是创建静态图形、动态图形还是交互式可视化,findobj()方法都是一个不可或缺的工具。
 极客教程
极客教程