Matplotlib中使用Artist.set_path_effects()实现高级视觉效果
参考:Matplotlib.artist.Artist.set_path_effects() in Python
Matplotlib是Python中最流行的数据可视化库之一,它提供了丰富的绘图功能和自定义选项。在Matplotlib中,Artist是所有可视化元素的基类,包括线条、文本、图形等。Artist类中的set_path_effects()方法是一个强大的工具,可以为绘图元素添加各种视觉效果,如阴影、描边、发光等。本文将深入探讨set_path_effects()方法的使用,并通过多个示例展示如何创建引人注目的可视化效果。
1. 理解Artist.set_path_effects()方法
set_path_effects()方法属于Matplotlib的Artist类,它允许我们为绘图元素添加路径效果。这些效果可以改变元素的外观,增加视觉吸引力或强调某些特定部分。
基本语法如下:
artist.set_path_effects(effects)
其中,effects是一个包含matplotlib.patheffects.AbstractPathEffect子类实例的列表。
让我们从一个简单的例子开始:
import matplotlib.pyplot as plt
import matplotlib.patheffects as path_effects

fig, ax = plt.subplots(figsize=(8, 6))
text = ax.text(0.5, 0.5, 'How2matplotlib.com', fontsize=40, ha='center', va='center')
text.set_path_effects([path_effects.withStroke(linewidth=3, foreground='red')])
plt.title('Simple Text with Stroke Effect')
plt.show()
Output:
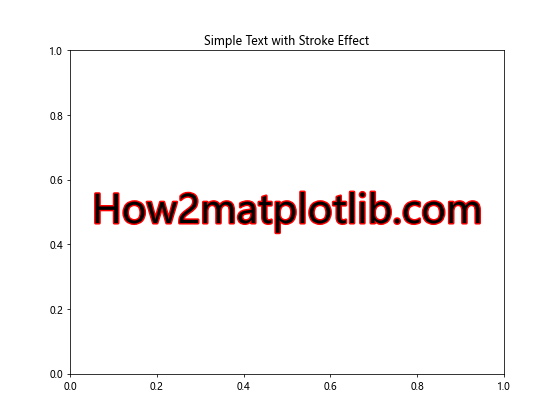
在这个例子中,我们创建了一个文本对象,然后使用set_path_effects()方法为文本添加了一个红色的描边效果。withStroke效果使文本周围出现一个轮廓,使其更加醒目。
2. 常用的路径效果
Matplotlib提供了多种预定义的路径效果,我们可以根据需要选择使用。以下是一些常用的路径效果:
2.1 Normal
Normal效果是最基本的效果,它不会对原始路径做任何改变。通常用作其他效果的基础。
import matplotlib.pyplot as plt
import matplotlib.patheffects as path_effects

fig, ax = plt.subplots(figsize=(8, 6))
text = ax.text(0.5, 0.5, 'How2matplotlib.com', fontsize=40, ha='center', va='center')
text.set_path_effects([path_effects.Normal()])
plt.title('Text with Normal Effect')
plt.show()
Output:
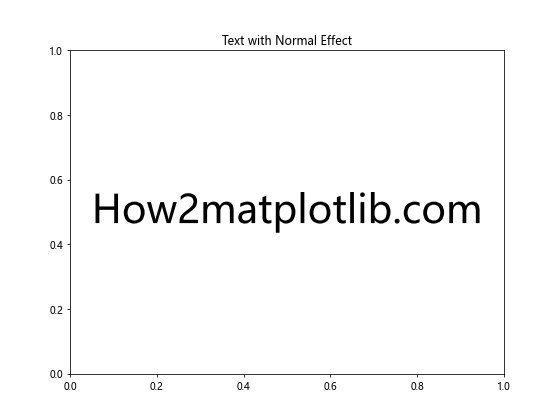
这个例子中,文本看起来没有任何特殊效果,因为Normal效果不会改变原始外观。
2.2 Stroke
Stroke效果为路径添加描边。我们可以指定描边的宽度和颜色。
import matplotlib.pyplot as plt
import matplotlib.patheffects as path_effects

fig, ax = plt.subplots(figsize=(8, 6))
text = ax.text(0.5, 0.5, 'How2matplotlib.com', fontsize=40, ha='center', va='center', color='white')
text.set_path_effects([
    path_effects.Stroke(linewidth=3, foreground='black'),
    path_effects.Normal()
])
plt.title('Text with Stroke Effect')
ax.set_facecolor('lightgray')
plt.show()
Output:
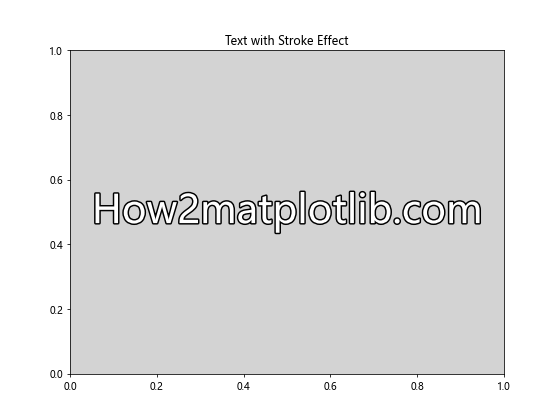
在这个例子中,我们为白色文本添加了黑色描边,使其在浅灰色背景上更加清晰可见。
2.3 Shadow
Shadow效果为路径添加阴影,可以指定阴影的偏移量和颜色。
import matplotlib.pyplot as plt
import matplotlib.patheffects as path_effects

fig, ax = plt.subplots(figsize=(8, 6))
text = ax.text(0.5, 0.5, 'How2matplotlib.com', fontsize=40, ha='center', va='center')
text.set_path_effects([
    path_effects.withSimplePatchShadow(offset=(2, -2), shadow_rgbFace='blue', alpha=0.6)
])
plt.title('Text with Shadow Effect')
plt.show()
Output:
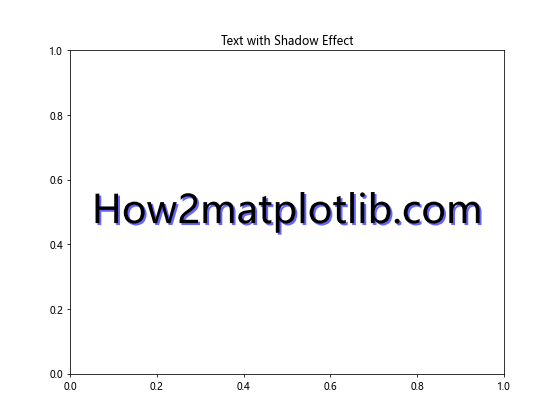
这个例子展示了如何为文本添加蓝色阴影,阴影向右下方偏移。
2.4 SimpleLineShadow
SimpleLineShadow效果专门用于为线条添加阴影效果。
import matplotlib.pyplot as plt
import matplotlib.patheffects as path_effects
import numpy as np

fig, ax = plt.subplots(figsize=(8, 6))
x = np.linspace(0, 10, 100)
y = np.sin(x)
line = ax.plot(x, y, label='How2matplotlib.com')[0]
line.set_path_effects([path_effects.SimpleLineShadow(), path_effects.Normal()])
plt.title('Line with Shadow Effect')
plt.legend()
plt.show()
Output:
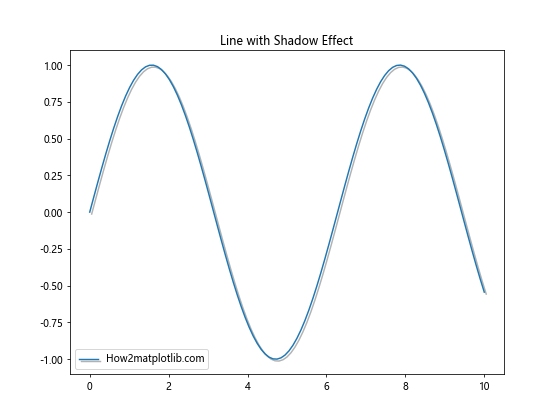
这个例子展示了如何为正弦曲线添加简单的线条阴影效果。
2.5 withTickedStroke
withTickedStroke效果可以为路径添加刻度线效果,使线条看起来像是由小段组成。
import matplotlib.pyplot as plt
import matplotlib.patheffects as path_effects
import numpy as np

fig, ax = plt.subplots(figsize=(8, 6))
x = np.linspace(0, 10, 100)
y = np.cos(x)
line = ax.plot(x, y, label='How2matplotlib.com')[0]
line.set_path_effects([path_effects.withTickedStroke(spacing=7, angle=45)])
plt.title('Line with Ticked Stroke Effect')
plt.legend()
plt.show()
Output:
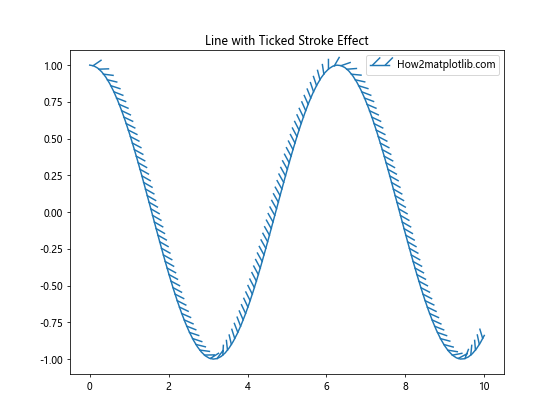
在这个例子中,我们为余弦曲线添加了刻度线效果,使其看起来像是由小段组成。
3. 组合多种路径效果
set_path_effects()方法的一个强大特性是可以组合多种效果。通过在效果列表中添加多个效果,我们可以创建复杂的视觉效果。
import matplotlib.pyplot as plt
import matplotlib.patheffects as path_effects

fig, ax = plt.subplots(figsize=(8, 6))
text = ax.text(0.5, 0.5, 'How2matplotlib.com', fontsize=40, ha='center', va='center', color='white')
text.set_path_effects([
    path_effects.Stroke(linewidth=3, foreground='black'),
    path_effects.Normal(),
    path_effects.withSimplePatchShadow(offset=(2, -2), shadow_rgbFace='blue', alpha=0.6)
])
plt.title('Text with Combined Effects')
ax.set_facecolor('lightgray')
plt.show()
Output:
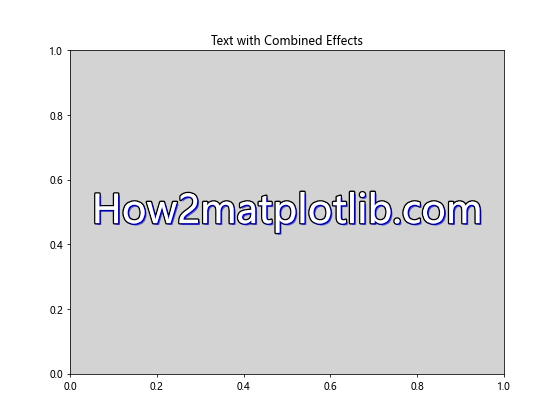
这个例子展示了如何组合描边、阴影和正常效果,创建一个既有轮廓又有阴影的文本。
4. 为不同类型的Artist应用路径效果
set_path_effects()方法不仅可以应用于文本,还可以应用于其他类型的Artist,如线条、标记、填充区域等。
4.1 为线条添加效果
import matplotlib.pyplot as plt
import matplotlib.patheffects as path_effects
import numpy as np

fig, ax = plt.subplots(figsize=(8, 6))
x = np.linspace(0, 10, 100)
y = np.sin(x)
line = ax.plot(x, y, linewidth=2, label='How2matplotlib.com')[0]
line.set_path_effects([
    path_effects.Stroke(linewidth=4, foreground='red'),
    path_effects.Normal()
])
plt.title('Line with Path Effects')
plt.legend()
plt.show()
Output:
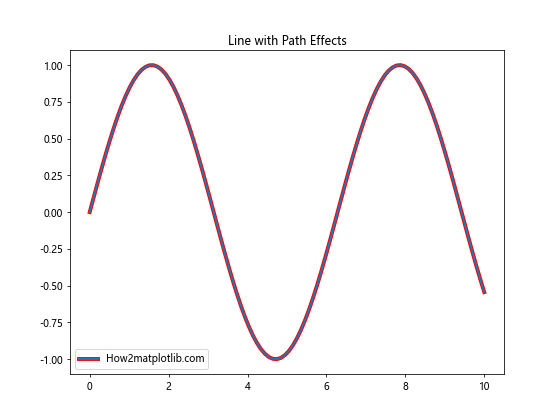
这个例子展示了如何为正弦曲线添加红色描边效果,使线条更加醒目。
4.2 为散点图添加效果
import matplotlib.pyplot as plt
import matplotlib.patheffects as path_effects
import numpy as np

fig, ax = plt.subplots(figsize=(8, 6))
x = np.random.rand(50)
y = np.random.rand(50)
scatter = ax.scatter(x, y, s=100, c='blue', label='How2matplotlib.com')
scatter.set_path_effects([path_effects.withSimplePatchShadow()])
plt.title('Scatter Plot with Shadow Effect')
plt.legend()
plt.show()
Output:
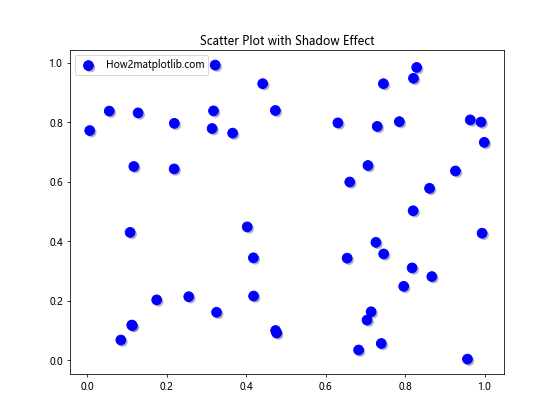
这个例子展示了如何为散点图中的点添加阴影效果,增加深度感。
4.3 为填充区域添加效果
import matplotlib.pyplot as plt
import matplotlib.patheffects as path_effects
import numpy as np

fig, ax = plt.subplots(figsize=(8, 6))
x = np.linspace(0, 10, 100)
y1 = np.sin(x)
y2 = np.cos(x)
fill = ax.fill_between(x, y1, y2, alpha=0.5, label='How2matplotlib.com')
fill.set_path_effects([path_effects.withSimplePatchShadow(offset=(2, -2))])
plt.title('Filled Area with Shadow Effect')
plt.legend()
plt.show()
这个例子展示了如何为两条曲线之间的填充区域添加阴影效果,增加立体感。
5. 自定义路径效果
除了使用Matplotlib提供的预定义效果,我们还可以通过继承AbstractPathEffect类来创建自定义的路径效果。
import matplotlib.pyplot as plt
import matplotlib.patheffects as path_effects
import numpy as np

class GlowEffect(path_effects.AbstractPathEffect):
    def __init__(self, offset=(1, 1), alpha=0.5, color='yellow', n_levels=5):
        super().__init__(offset)
        self.alpha = alpha
        self.color = color
        self.n_levels = n_levels

    def draw_path(self, renderer, gc, tpath, affine, rgbFace):
        gc0 = renderer.new_gc()
        gc0.copy_properties(gc)

        gc0.set_alpha(self.alpha)
        gc0.set_foreground(self.color)

        for i in range(self.n_levels):
            for offset in [(i, i), (-i, i), (i, -i), (-i, -i)]:
                renderer.draw_path(gc0, tpath, affine.translate(offset), rgbFace)

fig, ax = plt.subplots(figsize=(8, 6))
text = ax.text(0.5, 0.5, 'How2matplotlib.com', fontsize=40, ha='center', va='center')
text.set_path_effects([GlowEffect(), path_effects.Normal()])
plt.title('Text with Custom Glow Effect')
plt.show()
在这个例子中,我们创建了一个自定义的GlowEffect类,它通过多次绘制略微偏移的路径来创建发光效果。
6. 在图例中使用路径效果
路径效果不仅可以应用于图表中的元素,还可以应用于图例中的元素,使图例更加醒目或与主图表保持一致的风格。
import matplotlib.pyplot as plt
import matplotlib.patheffects as path_effects
import numpy as np

fig, ax = plt.subplots(figsize=(8, 6))
x = np.linspace(0, 10, 100)
y1 = np.sin(x)
y2 = np.cos(x)

line1 = ax.plot(x, y1, label='Sin(x) - How2matplotlib.com')[0]
line2 = ax.plot(x, y2, label='Cos(x) - How2matplotlib.com')[0]

line1.set_path_effects([path_effects.Stroke(linewidth=3, foreground='red'), path_effects.Normal()])
line2.set_path_effects([path_effects.Stroke(linewidth=3, foreground='blue'), path_effects.Normal()])

legend = ax.legend()
for text in legend.get_texts():
    text.set_path_effects([path_effects.withStroke(linewidth=2, foreground='gray')])

plt.title('Lines with Path Effects in Plot and Legend')
plt.show()
Output:
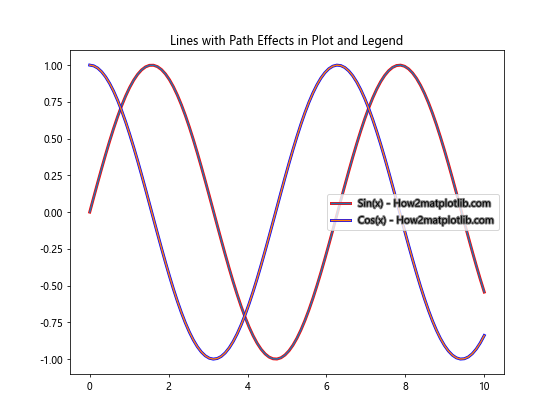
这个例子展示了如何为图表中的线条和图例中的文本添加路径效果,使整个图表看起来更加协调一致。
7. 在3D图表中使用路径效果
虽然路径效果主要用于2D图表,但在某些情况下,我们也可以在3D图表中使用它们来增强视觉效果。
import matplotlib.pyplot as plt
import matplotlib.patheffects as path_effects
import numpy as np
from mpl_toolkits.mplot3d import Axes3D

fig = plt.figure(figsize=(10, 8))
ax = fig.add_subplot(111, projection='3d')

x = np.linspace(-5, 5, 100)
y = np.linspace(-5, 5, 100)
X, Y = np.meshgrid(x, y)
Z = np.sin(np.sqrt(X**2 + Y**2))

surf = ax.plot_surface(X, Y, Z, cmap='viridis')

text = ax.text(0, 0, 1.5, 'How2matplotlib.com', fontsize=20, ha='center', va='center')
text.set_path_effects([path_effects.Stroke(linewidth=3, foreground='white'), path_effects.Normal()])

plt.title('3D Surface Plot with Text Path Effect')
plt.show()
Output:
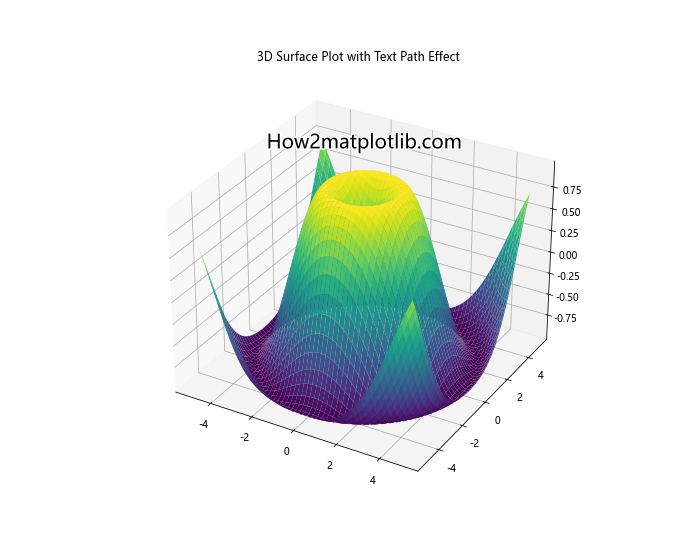
在这个例子中,我们创建了一个3D表面图,并在其上方添加了一个带有路径效果的文本。虽然3D图表中的其他元素不支持路径效果,但文本仍然可以使用这些效果来增强可读性。
8. 动画中的路径效果
路径效果也可以在动画中使用,为动态图表添加更多视觉吸引力。
import matplotlib.pyplot as plt
import matplotlib.patheffects as path_effects
import matplotlib.animation as animationimport numpy as np

fig, ax = plt.subplots(figsize=(8, 6))
x = np.linspace(0, 2*np.pi, 100)
line, = ax.plot(x, np.sin(x), label='How2matplotlib.com')
line.set_path_effects([path_effects.withSimplePatchShadow()])

text = ax.text(np.pi, 0, 'How2matplotlib.com', ha='center', va='center', fontsize=20)
text.set_path_effects([path_effects.Stroke(linewidth=2, foreground='red'), path_effects.Normal()])

def animate(frame):
    line.set_ydata(np.sin(x + frame/10))
    return line,

ani = animation.FuncAnimation(fig, animate, frames=100, interval=50, blit=True)
plt.title('Animated Sine Wave with Path Effects')
plt.show()
这个例子展示了如何在动画中使用路径效果。我们创建了一个带有阴影效果的正弦波动画,并添加了一个带有描边效果的文本。
9. 在子图中使用路径效果
当我们使用子图时,可以为每个子图中的元素单独应用路径效果,从而创建更复杂的可视化效果。
import matplotlib.pyplot as plt
import matplotlib.patheffects as path_effects
import numpy as np

fig, (ax1, ax2) = plt.subplots(1, 2, figsize=(12, 6))

# 子图1:带阴影效果的散点图
x1 = np.random.rand(50)
y1 = np.random.rand(50)
scatter = ax1.scatter(x1, y1, s=100, c='blue', label='How2matplotlib.com')
scatter.set_path_effects([path_effects.withSimplePatchShadow()])
ax1.set_title('Scatter Plot with Shadow')

# 子图2:带描边效果的线图
x2 = np.linspace(0, 10, 100)
y2 = np.sin(x2)
line = ax2.plot(x2, y2, label='How2matplotlib.com')[0]
line.set_path_effects([path_effects.Stroke(linewidth=4, foreground='red'), path_effects.Normal()])
ax2.set_title('Line Plot with Stroke')

plt.tight_layout()
plt.show()
Output:
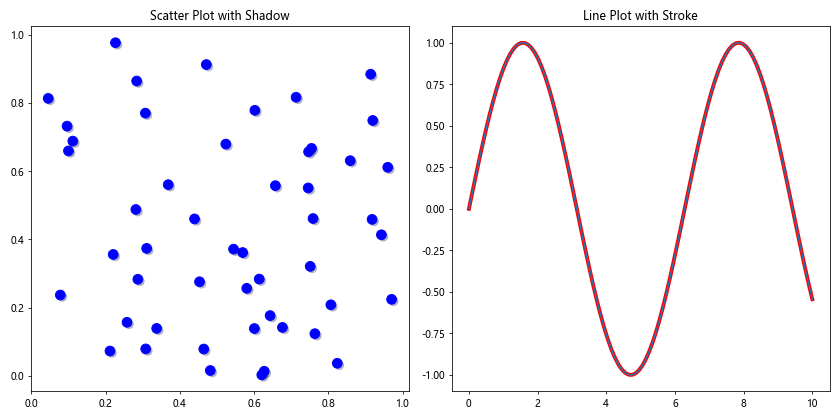
这个例子展示了如何在两个子图中分别使用不同的路径效果:一个子图中的散点图使用阴影效果,另一个子图中的线图使用描边效果。
10. 在极坐标图中使用路径效果
路径效果也可以应用于极坐标图,为这种特殊的图表类型增添视觉吸引力。
import matplotlib.pyplot as plt
import matplotlib.patheffects as path_effects
import numpy as np

fig = plt.figure(figsize=(8, 8))
ax = fig.add_subplot(111, projection='polar')

r = np.linspace(0, 1, 100)
theta = 2 * np.pi * r

line = ax.plot(theta, r, label='How2matplotlib.com')[0]
line.set_path_effects([path_effects.Stroke(linewidth=3, foreground='red'), path_effects.Normal()])

text = ax.text(0, 0.5, 'How2matplotlib.com', ha='center', va='center', fontsize=20)
text.set_path_effects([path_effects.withSimplePatchShadow()])

plt.title('Polar Plot with Path Effects')
plt.show()
Output:
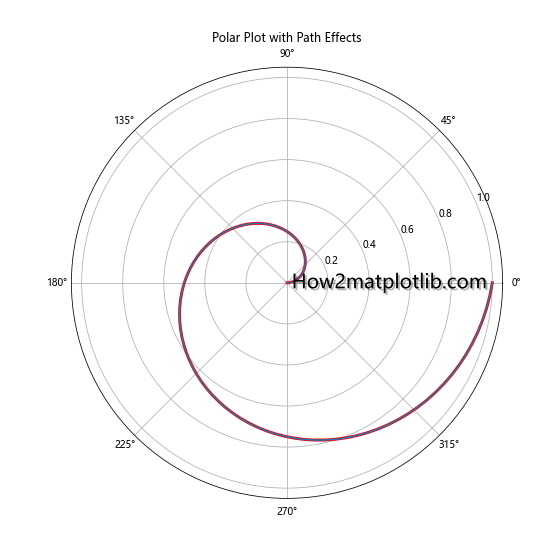
这个例子展示了如何在极坐标图中为螺旋线添加描边效果,并为文本添加阴影效果。
11. 在等高线图中使用路径效果
等高线图是另一种可以受益于路径效果的图表类型。我们可以为等高线添加效果,使其更加醒目。
import matplotlib.pyplot as plt
import matplotlib.patheffects as path_effects
import numpy as np

fig, ax = plt.subplots(figsize=(8, 6))

x = np.linspace(-3, 3, 100)
y = np.linspace(-3, 3, 100)
X, Y = np.meshgrid(x, y)
Z = np.sin(X) * np.cos(Y)

contours = ax.contour(X, Y, Z, levels=10)

for collection in contours.collections:
    collection.set_path_effects([path_effects.withSimplePatchShadow()])

text = ax.text(0, 0, 'How2matplotlib.com', ha='center', va='center', fontsize=20)
text.set_path_effects([path_effects.Stroke(linewidth=2, foreground='white'), path_effects.Normal()])

plt.title('Contour Plot with Path Effects')
plt.colorbar(contours)
plt.show()
Output:
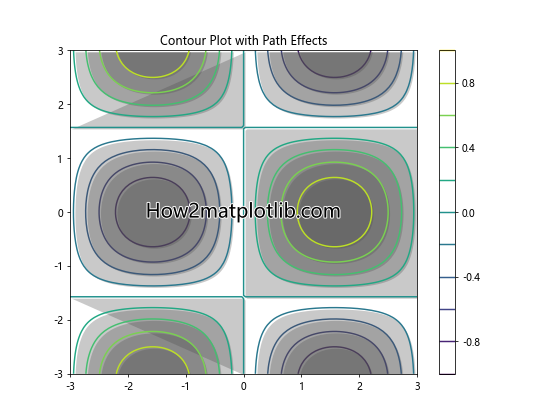
这个例子展示了如何为等高线添加阴影效果,并为中心的文本添加白色描边效果。
12. 在箱线图中使用路径效果
箱线图是统计可视化中常用的图表类型,我们也可以为其添加路径效果以增强视觉效果。
import matplotlib.pyplot as plt
import matplotlib.patheffects as path_effects
import numpy as np

fig, ax = plt.subplots(figsize=(8, 6))

data = [np.random.normal(0, std, 100) for std in range(1, 4)]
box = ax.boxplot(data, patch_artist=True)

for element in ['boxes', 'whiskers', 'fliers', 'means', 'medians', 'caps']:
    plt.setp(box[element], path_effects=[path_effects.withSimplePatchShadow()])

ax.set_xticklabels(['A', 'B', 'C'])
ax.set_title('Box Plot with Path Effects')

text = ax.text(2, 5, 'How2matplotlib.com', ha='center', va='center', fontsize=20)
text.set_path_effects([path_effects.Stroke(linewidth=2, foreground='red'), path_effects.Normal()])

plt.show()
Output:
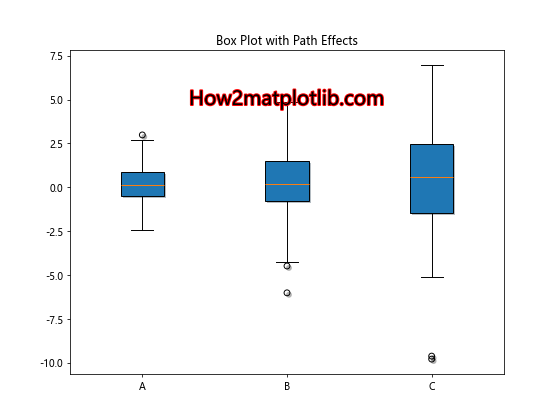
这个例子展示了如何为箱线图的各个元素添加阴影效果,并为文本添加红色描边效果。
13. 在热力图中使用路径效果
虽然热力图本身不支持路径效果,但我们可以为热力图中的文本标签添加效果,以增强可读性。
import matplotlib.pyplot as plt
import matplotlib.patheffects as path_effects
import numpy as np

fig, ax = plt.subplots(figsize=(8, 6))

data = np.random.rand(10, 10)
im = ax.imshow(data, cmap='viridis')

for i in range(10):
    for j in range(10):
        text = ax.text(j, i, f'{data[i, j]:.2f}', ha='center', va='center', color='w')
        text.set_path_effects([path_effects.withStroke(linewidth=1, foreground='black')])

plt.colorbar(im)
plt.title('Heatmap with Text Path Effects')

text = ax.text(5, -1, 'How2matplotlib.com', ha='center', va='center', fontsize=20)
text.set_path_effects([path_effects.Stroke(linewidth=2, foreground='red'), path_effects.Normal()])

plt.show()
Output:
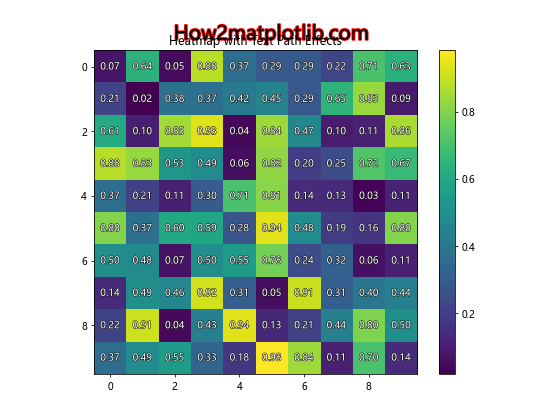
这个例子展示了如何为热力图中的数值标签添加黑色描边效果,以增强其在不同背景色上的可读性。
14. 在树状图中使用路径效果
树状图(Dendrogram)是一种用于展示层次聚类结果的图表类型。我们可以为其添加路径效果以增强视觉效果。
import matplotlib.pyplot as plt
import matplotlib.patheffects as path_effects
import numpy as np
from scipy.cluster.hierarchy import dendrogram, linkage

fig, ax = plt.subplots(figsize=(10, 6))

# 生成随机数据
X = np.random.rand(10, 2)
Z = linkage(X, 'ward')

# 绘制树状图
den = dendrogram(Z)

# 为树状图的线条添加路径效果
for c in den['icoord']:
    x = 0.5 * sum(c[1:3])
    y = c[1]
    line = plt.Line2D([x, x], [y, y+10], linewidth=1, color='k')
    line.set_path_effects([path_effects.Stroke(linewidth=2, foreground='blue'), path_effects.Normal()])
    ax.add_line(line)

plt.title('Dendrogram with Path Effects')

text = ax.text(5, -5, 'How2matplotlib.com', ha='center', va='center', fontsize=20)
text.set_path_effects([path_effects.withSimplePatchShadow()])

plt.show()
Output:
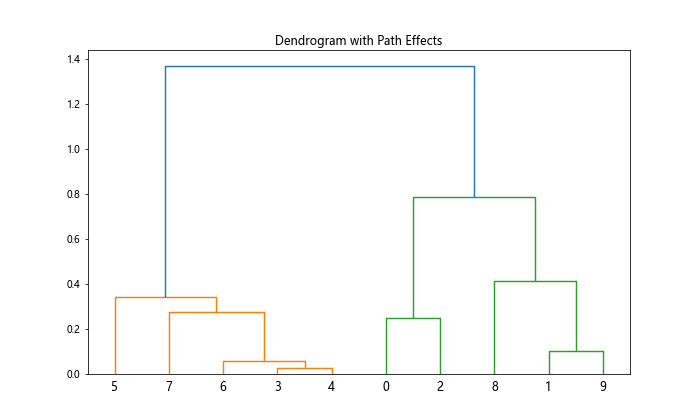
这个例子展示了如何为树状图的连接线添加蓝色描边效果,并为文本添加阴影效果。
结论
Matplotlib的Artist.set_path_effects()方法是一个强大的工具,可以大大增强数据可视化的视觉吸引力和可读性。通过本文的详细介绍和丰富的示例,我们探索了如何在各种图表类型中应用路径效果,包括基本的文本和线条效果、复杂的组合效果,以及在动画和3D图表中的应用。
路径效果不仅可以美化图表,还可以强调重要信息,增加图表的深度感和立体感。通过创造性地使用这些效果,我们可以制作出既美观又富有信息量的数据可视化作品。
在实际应用中,建议根据数据的特性和可视化的目的来选择合适的路径效果。过度使用效果可能会分散读者对数据本身的注意力,因此在使用时需要保持适度和平衡。
随着对Matplotlib的深入学习,你会发现set_path_effects()方法还有更多潜在的应用场景。希望本文能够激发你的创意,帮助你在数据可视化中创造出更加引人注目和富有洞察力的图表。
 极客教程
极客教程