Matplotlib中使用Artist.set_label()方法设置图形元素标签
参考:Matplotlib.artist.Artist.set_label() in Python
Matplotlib是Python中最流行的数据可视化库之一,它提供了丰富的绘图功能和灵活的自定义选项。在Matplotlib中,几乎所有可见的图形元素都是Artist对象的实例。Artist类是Matplotlib中的基础类,它定义了许多通用属性和方法,其中set_label()方法是一个非常有用的功能,用于为图形元素设置标签。本文将深入探讨Artist.set_label()方法的使用,并通过多个示例展示如何在不同场景下应用这个方法来增强图表的可读性和交互性。
1. Artist.set_label()方法简介
Artist.set_label()是Matplotlib中Artist类的一个方法,用于为图形元素设置标签。这个标签可以用于多种用途,如在图例中显示、在工具提示中显示,或者作为对象的标识符。
基本语法如下:
artist.set_label(label)
其中,artist是任何Artist对象的实例,label是一个字符串,表示要设置的标签内容。
让我们看一个简单的例子:
import matplotlib.pyplot as plt

fig, ax = plt.subplots()
line, = ax.plot([1, 2, 3, 4], [1, 4, 2, 3])
line.set_label('Data from how2matplotlib.com')
ax.legend()
plt.show()
Output:

在这个例子中,我们创建了一个简单的线图,然后使用set_label()方法为线条设置了标签。通过调用ax.legend(),我们可以在图表中显示包含这个标签的图例。
2. 为不同类型的Artist对象设置标签
Matplotlib中有多种类型的Artist对象,如Line2D(线条)、Rectangle(矩形)、Text(文本)等。我们可以为这些不同类型的对象设置标签。
2.1 为Line2D对象设置标签
Line2D对象通常用于绘制线图或散点图。以下是一个为多条线设置不同标签的例子:
import matplotlib.pyplot as plt
import numpy as np

x = np.linspace(0, 10, 100)
fig, ax = plt.subplots()

line1, = ax.plot(x, np.sin(x))
line2, = ax.plot(x, np.cos(x))

line1.set_label('Sine wave from how2matplotlib.com')
line2.set_label('Cosine wave from how2matplotlib.com')

ax.legend()
plt.show()
Output:
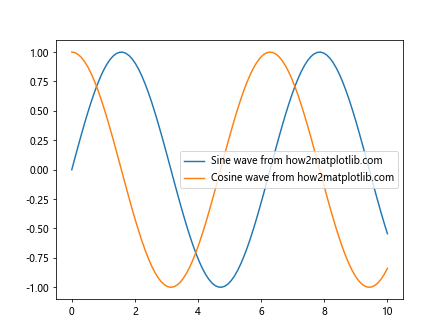
在这个例子中,我们绘制了正弦和余弦曲线,并为每条曲线设置了不同的标签。通过调用ax.legend(),这些标签会显示在图例中。
2.2 为散点图设置标签
散点图也是使用Line2D对象绘制的,我们可以用类似的方式设置标签:
import matplotlib.pyplot as plt
import numpy as np

np.random.seed(42)
x = np.random.rand(50)
y1 = x + 0.1 * np.random.randn(50)
y2 = x**2 + 0.1 * np.random.randn(50)

fig, ax = plt.subplots()

scatter1 = ax.scatter(x, y1, c='blue')
scatter2 = ax.scatter(x, y2, c='red')

scatter1.set_label('Linear data from how2matplotlib.com')
scatter2.set_label('Quadratic data from how2matplotlib.com')

ax.legend()
plt.show()
Output:
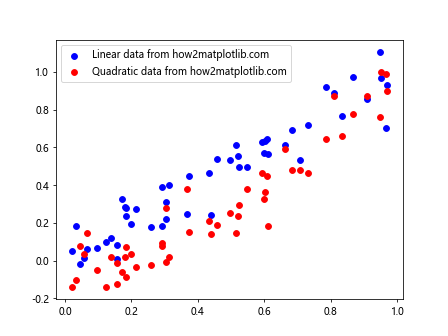
这个例子展示了如何为两组散点数据设置不同的标签。
2.3 为柱状图设置标签
柱状图中的每个柱子都是一个Rectangle对象,我们可以为整个柱状图设置标签:
import matplotlib.pyplot as plt
import numpy as np

categories = ['A', 'B', 'C', 'D']
values = [3, 7, 2, 5]

fig, ax = plt.subplots()
bars = ax.bar(categories, values)

bars.set_label('Data from how2matplotlib.com')
ax.legend()
plt.show()
Output:
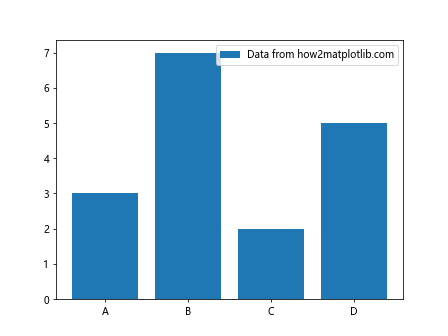
在这个例子中,我们为整个柱状图设置了一个标签。
3. 使用set_label()方法自定义图例
set_label()方法不仅可以用于设置简单的文本标签,还可以用于创建更复杂的自定义图例。
3.1 创建包含多个元素的图例
我们可以为图表中的多个元素设置标签,然后在图例中显示它们:
import matplotlib.pyplot as plt
import numpy as np

x = np.linspace(0, 10, 100)
fig, ax = plt.subplots()

line1, = ax.plot(x, np.sin(x), 'r-')
line2, = ax.plot(x, np.cos(x), 'b--')
scatter = ax.scatter(x[::10], np.sin(x[::10]), c='g')

line1.set_label('Sine wave from how2matplotlib.com')
line2.set_label('Cosine wave from how2matplotlib.com')
scatter.set_label('Sampled points from how2matplotlib.com')

ax.legend()
plt.show()
Output:
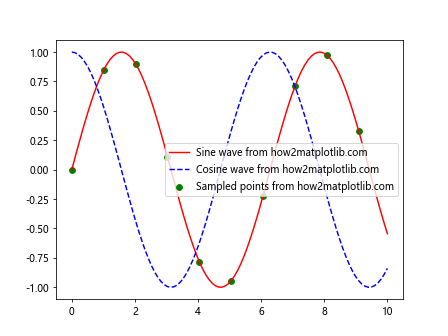
这个例子展示了如何在一个图表中为线条和散点设置不同的标签,并在图例中显示它们。
3.2 使用set_label()和自定义handler
我们可以结合使用set_label()方法和自定义的图例处理程序(handler)来创建更复杂的图例:
import matplotlib.pyplot as plt
import matplotlib.patches as mpatches

fig, ax = plt.subplots()

# 创建一些数据
ax.plot([1, 2, 3], [1, 2, 3], 'ro-')

# 创建自定义图例元素
red_patch = mpatches.Patch(color='red', label='Red data from how2matplotlib.com')
line_patch = mpatches.Patch(color='blue', label='Blue line from how2matplotlib.com')

# 使用set_label()方法设置标签
red_patch.set_label('Updated red data from how2matplotlib.com')
line_patch.set_label('Updated blue line from how2matplotlib.com')

# 添加图例
ax.legend(handles=[red_patch, line_patch])

plt.show()
Output:
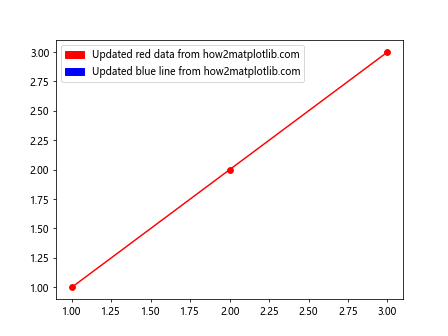
在这个例子中,我们创建了自定义的图例元素,并使用set_label()方法更新了它们的标签。
4. 动态更新标签
set_label()方法的一个强大特性是它允许我们动态更新图形元素的标签。这在创建交互式图表或动画时特别有用。
4.1 在动画中更新标签
以下是一个简单的动画示例,展示了如何在动画过程中更新线条的标签:
import matplotlib.pyplot as plt
import numpy as np
from matplotlib.animation import FuncAnimation

fig, ax = plt.subplots()
x = np.linspace(0, 2*np.pi, 100)
line, = ax.plot(x, np.sin(x))

def update(frame):
    line.set_ydata(np.sin(x + frame/10))
    line.set_label(f'Sin(x + {frame/10:.2f}) from how2matplotlib.com')
    ax.legend(loc='upper right')
    return line,

ani = FuncAnimation(fig, update, frames=np.linspace(0, 2*np.pi, 128),
                    blit=True, interval=50)
plt.show()
Output:
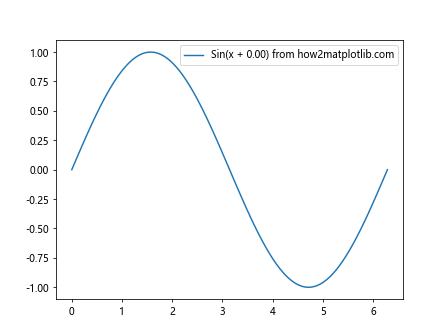
这个动画展示了一个移动的正弦波,标签会随着波形的变化而更新。
4.2 响应用户交互更新标签
我们还可以创建响应用户交互的图表,根据用户的操作动态更新标签:
import matplotlib.pyplot as plt
import numpy as np

fig, ax = plt.subplots()
x = np.linspace(0, 10, 100)
line, = ax.plot(x, np.sin(x))
line.set_label('Click to update label')
ax.legend()

def on_click(event):
    if event.inaxes == ax:
        line.set_label(f'Clicked at x={event.xdata:.2f}, y={event.ydata:.2f} (how2matplotlib.com)')
        ax.legend()
        fig.canvas.draw()

fig.canvas.mpl_connect('button_press_event', on_click)
plt.show()
Output:
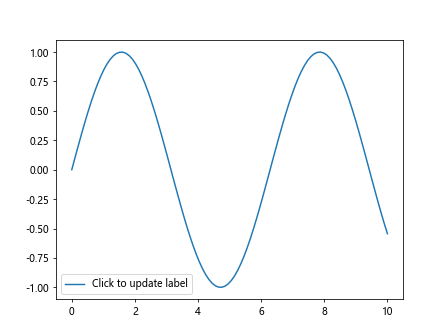
在这个例子中,每次用户点击图表时,线条的标签都会更新为点击位置的坐标。
5. 在子图中使用set_label()
当我们使用子图时,可以为每个子图中的元素单独设置标签:
import matplotlib.pyplot as plt
import numpy as np

fig, (ax1, ax2) = plt.subplots(1, 2, figsize=(10, 4))

x = np.linspace(0, 10, 100)

line1, = ax1.plot(x, np.sin(x))
line1.set_label('Sine wave in subplot 1 (how2matplotlib.com)')
ax1.legend()

line2, = ax2.plot(x, np.cos(x))
line2.set_label('Cosine wave in subplot 2 (how2matplotlib.com)')
ax2.legend()

plt.tight_layout()
plt.show()
Output:
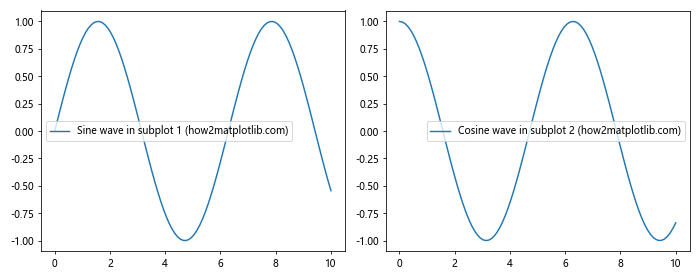
这个例子展示了如何在两个子图中分别设置和显示标签。
6. 使用set_label()和自定义图例
我们可以结合使用set_label()方法和自定义图例来创建更复杂的图表说明:
import matplotlib.pyplot as plt
import numpy as np

fig, ax = plt.subplots()

x = np.linspace(0, 10, 100)
y1 = np.sin(x)
y2 = np.cos(x)

line1, = ax.plot(x, y1, 'r-')
line2, = ax.plot(x, y2, 'b--')

line1.set_label('Sine wave')
line2.set_label('Cosine wave')

# 创建自定义图例
legend_elements = [
    plt.Line2D([0], [0], color='r', lw=2, label='Sine wave (how2matplotlib.com)'),
    plt.Line2D([0], [0], color='b', linestyle='--', lw=2, label='Cosine wave (how2matplotlib.com)'),
    plt.Line2D([0], [0], marker='o', color='w', markerfacecolor='g', markersize=10,
               label='Peak points (how2matplotlib.com)')
]

ax.legend(handles=legend_elements)
plt.show()
Output:
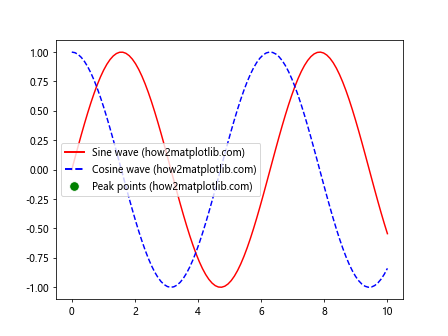
在这个例子中,我们使用set_label()方法设置了线条的基本标签,然后创建了一个包含额外信息的自定义图例。
7. 在3D图中使用set_label()
set_label()方法也可以用于3D图形:
import matplotlib.pyplot as plt
import numpy as np

fig = plt.figure()
ax = fig.add_subplot(111, projection='3d')

# 创建一些示例数据
x = np.linspace(-5, 5, 100)
y = np.linspace(-5, 5, 100)
X, Y = np.meshgrid(x, y)
Z = np.sin(np.sqrt(X**2 + Y**2))

# 绘制曲面
surf = ax.plot_surface(X, Y, Z)
surf.set_label('3D surface from how2matplotlib.com')

# 绘制等高线
contour = ax.contour(X, Y, Z, zdir='z', offset=-2)
contour.collections[0].set_label('Contour at z=-2 (how2matplotlib.com)')

ax.legend()
plt.show()
这个例子展示了如何在3D图中为曲面和等高线设置标签。
8. 使用set_label()和颜色映射
当使用颜色映射(colormap)时,我们也可以为不同的颜色范围设置标签:
import matplotlib.pyplot as plt
import numpy as np

fig, ax = plt.subplots()

# 创建一些示例数据
x = np.linspace(0, 10, 100)
y = np.linspace(0, 10, 100)
X, Y = np.meshgrid(x, y)
Z = np.sin(X) * np.cos(Y)

# 绘制颜色映射
im = ax.imshow(Z, cmap='viridis', extent=[0, 10, 0, 10])
im.set_label('Color map from how2matplotlib.com')

# 添加颜色条
cbar = fig.colorbar(im)
cbar.set_label('Values')

# 在图上添加一些点
scatter = ax.scatter([2, 5, 8], [3, 6, 9], c='red')
scatter.set_label('Sample points')

ax.legend()
plt.show()
Output:
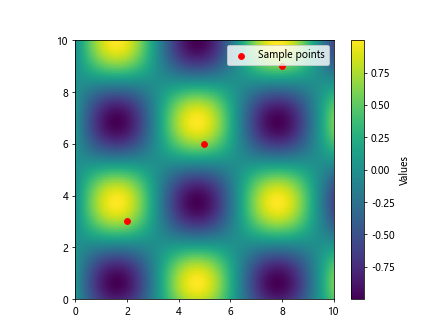
这个例子展示了如何为颜色映射和散点设置标签,并在图例中显示它们。
9. 在极坐标图中使用set_label()
set_label()方法同样适用于极坐标图:
import matplotlib.pyplot as plt
import numpy as np

fig, ax = plt.subplots(subplot_kw=dict(projection='polar'))

r = np.linspace(0, 2, 100)
theta = 2 * np.pi * r

line, = ax.plot(theta, r)
line.set_label('Spiral from how2matplotlib.com')

scatter = ax.scatter([0, np.pi/2, np.pi, 3*np.pi/2], [1, 1, 1, 1])
scatter.set_label('Cardinal points')

ax.legend()
plt.show()
Output:
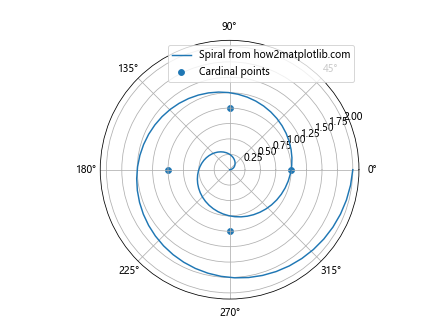
这个例子展示了如何在极坐标图中为螺旋线和散点设置标签。
10. 结合set_label()和自定义标记
我们可以结合使用set_label()方法和自定义标记来创建更具信息量的图例:
import matplotlib.pyplot as plt
import numpy as np

fig, ax = plt.subplots()

x = np.linspace(0, 10, 100)
y1 = np.sin(x)
y2 = np.cos(x)

line1, = ax.plot(x, y1, 'r-', marker='o', markevery=10)
line2, = ax.plot(x, y2, 'b--', marker='s', markevery=10)

line1.set_label('Sine wave with circles (how2matplotlib.com)')
line2.set_label('Cosine wave with squares (how2matplotlib.com)')

# 创建自定义标记
ax.plot([], [], 'go', label='Peak (how2matplotlib.com)')
ax.plot([], [], 'rv', label='Trough (how2matplotlib.com)')

# 添加一些峰值和谷值点
ax.plot(np.pi/2, 1, 'go')
ax.plot(3*np.pi/2, -1, 'rv')

ax.legend()
plt.show()
Output:
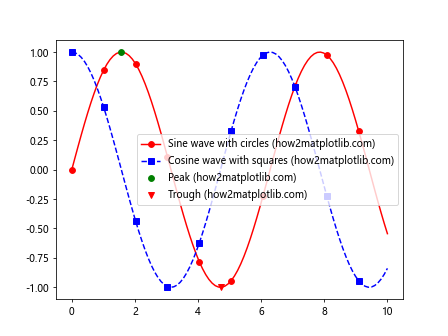
在这个例子中,我们不仅为线条设置了标签,还添加了自定义标记来表示峰值和谷值,并将它们包含在图例中。
11. 在箱线图中使用set_label()
箱线图是另一种常用的统计图表,我们也可以为其设置标签:
import matplotlib.pyplot as plt
import numpy as np

fig, ax = plt.subplots()

# 生成一些随机数据
data = [np.random.normal(0, std, 100) for std in range(1, 4)]

# 创建箱线图
bplot = ax.boxplot(data, patch_artist=True)

# 为每个箱子设置颜色和标签
colors = ['pink', 'lightblue', 'lightgreen']
for patch, color in zip(bplot['boxes'], colors):
    patch.set_facecolor(color)
    patch.set_label(f'{color} box (how2matplotlib.com)')

ax.legend()
ax.set_xticklabels(['A', 'B', 'C'])
plt.show()
Output:
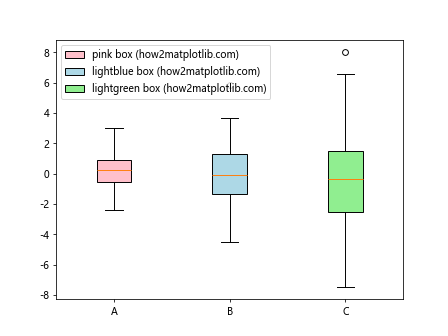
这个例子展示了如何为箱线图中的每个箱子设置不同的颜色和标签。
12. 在热图中使用set_label()
热图是展示矩阵数据的有效方式,我们可以为热图的不同部分设置标签:
import matplotlib.pyplot as plt
import numpy as np

fig, ax = plt.subplots()

# 创建一些示例数据
data = np.random.rand(10, 10)

# 创建热图
im = ax.imshow(data, cmap='viridis')
im.set_label('Heat map data (how2matplotlib.com)')

# 添加颜色条
cbar = fig.colorbar(im)
cbar.set_label('Values')

# 在热图上添加一些标记点
scatter = ax.scatter([2, 5, 8], [3, 6, 9], c='red', s=100)
scatter.set_label('Points of interest')

ax.legend(loc='upper left', bbox_to_anchor=(1, 1))
plt.tight_layout()
plt.show()
Output:
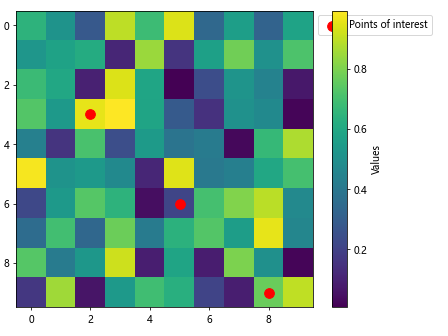
这个例子展示了如何为热图和其上的特殊点设置标签。
13. 在等高线图中使用set_label()
等高线图是展示三维数据的另一种方式,我们可以为不同的等高线设置标签:
import matplotlib.pyplot as plt
import numpy as np

fig, ax = plt.subplots()

# 创建一些示例数据
x = np.linspace(-3, 3, 100)
y = np.linspace(-3, 3, 100)
X, Y = np.meshgrid(x, y)
Z = np.exp(-(X**2 + Y**2))

# 绘制等高线
cs = ax.contour(X, Y, Z, levels=np.linspace(0.1, 0.9, 5))

# 为每条等高线设置标签
for i, c in enumerate(cs.collections):
    c.set_label(f'Level {i+1} (how2matplotlib.com)')

ax.legend(loc='upper right')
plt.show()
Output:
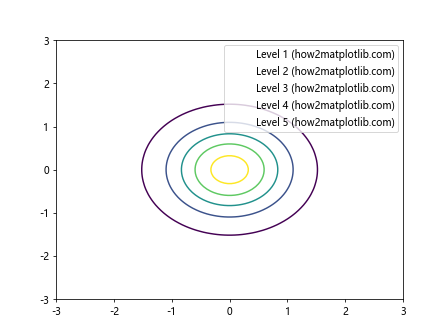
这个例子展示了如何为等高线图中的每条等高线设置标签。
14. 在饼图中使用set_label()
饼图通常用于展示比例数据,我们可以为每个扇形设置标签:
import matplotlib.pyplot as plt

fig, ax = plt.subplots()

sizes = [15, 30, 45, 10]
labels = ['A', 'B', 'C', 'D']
colors = ['gold', 'yellowgreen', 'lightcoral', 'lightskyblue']

wedges, texts = ax.pie(sizes, colors=colors, startangle=90)

for wedge, label in zip(wedges, labels):
    wedge.set_label(f'{label} (how2matplotlib.com)')

ax.legend(title="Categories")
plt.show()
Output:
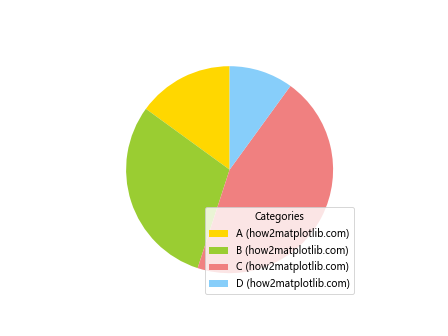
这个例子展示了如何为饼图中的每个扇形设置标签。
15. 在堆叠图中使用set_label()
堆叠图用于展示多个数据系列的累积效果,我们可以为每个数据系列设置标签:
import matplotlib.pyplot as plt
import numpy as np

fig, ax = plt.subplots()

x = np.arange(10)
y1 = np.random.rand(10)
y2 = np.random.rand(10)
y3 = np.random.rand(10)

stack = ax.stackplot(x, y1, y2, y3)

for s, label in zip(stack, ['Series 1', 'Series 2', 'Series 3']):
    s.set_label(f'{label} (how2matplotlib.com)')

ax.legend(loc='upper left')
plt.show()
Output:
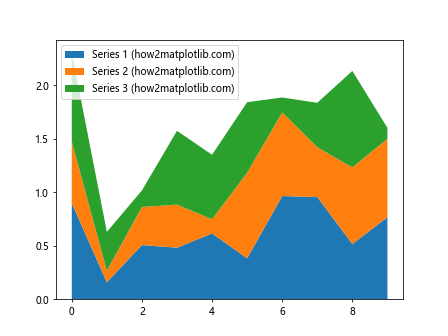
这个例子展示了如何为堆叠图中的每个数据系列设置标签。
16. 在误差棒图中使用set_label()
误差棒图用于展示数据的不确定性,我们可以为数据点和误差棒分别设置标签:
import matplotlib.pyplot as plt
import numpy as np

fig, ax = plt.subplots()

x = np.arange(0, 4, 0.2)
y = np.exp(-x)
yerr = 0.1 + 0.2*np.sqrt(x)

line, caps, bars = ax.errorbar(x, y, yerr=yerr, fmt='ro-', capsize=5)

line.set_label('Data points (how2matplotlib.com)')
bars[0].set_label('Error bars (how2matplotlib.com)')

ax.legend()
plt.show()
Output:
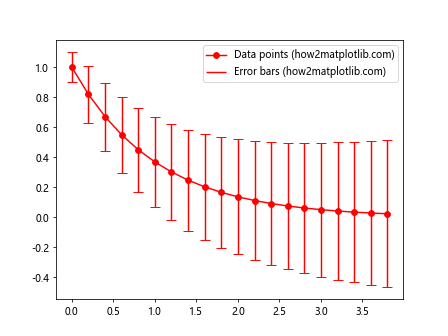
这个例子展示了如何为误差棒图中的数据点和误差棒分别设置标签。
17. 在填充图中使用set_label()
填充图用于强调某些区域,我们可以为填充区域设置标签:
import matplotlib.pyplot as plt
import numpy as np

fig, ax = plt.subplots()

x = np.linspace(0, 10, 100)
y1 = np.sin(x)
y2 = np.sin(x) + 0.5

line, = ax.plot(x, y1, 'b-')
fill = ax.fill_between(x, y1, y2, alpha=0.3)

line.set_label('Sine wave (how2matplotlib.com)')
fill.set_label('Filled region (how2matplotlib.com)')

ax.legend()
plt.show()
Output:
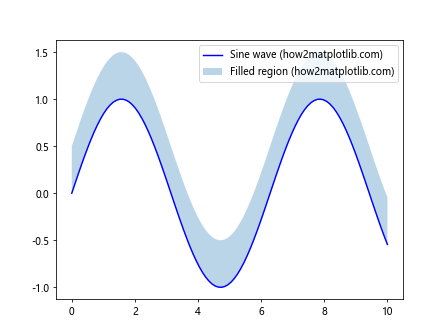
这个例子展示了如何为线条和填充区域分别设置标签。
结论
通过本文的详细介绍和丰富的示例,我们可以看到Artist.set_label()方法在Matplotlib中的强大功能和广泛应用。这个方法不仅可以用于简单地为图形元素添加标签,还可以与其他Matplotlib功能结合,创建复杂的、信息丰富的图例和交互式图表。
无论是在基本的线图、散点图中,还是在更复杂的3D图、热图、等高线图等中,set_label()方法都能发挥重要作用。它可以帮助我们清晰地标识不同的数据系列,解释图表中的特殊点或区域,甚至可以用于创建动态更新的标签。
在实际应用中,合理使用set_label()方法可以大大提高图表的可读性和信息传递效率。通过为图形元素添加恰当的标签,我们可以使复杂的数据可视化变得更加直观和易于理解。
最后,值得注意的是,set_label()方法通常需要与legend()方法配合使用,以在图表中显示设置的标签。在一些特殊的图表类型中(如饼图),可能需要使用其他方法来显示标签。因此,在使用set_label()方法时,务必了解具体的图表类型和Matplotlib的相关功能,以达到最佳的展示效果。
 极客教程
极客教程