Matplotlib中使用Artist.set_picker()实现交互式图形选择
参考:Matplotlib.artist.Artist.set_picker() in Python
Matplotlib是Python中强大的数据可视化库,而Artist.set_picker()方法是其中一个重要的功能,它允许用户在图形中实现交互式元素选择。本文将深入探讨如何使用set_picker()方法来增强图形的交互性,使数据可视化更加动态和用户友好。
1. Artist.set_picker()方法简介
Artist.set_picker()是Matplotlib中Artist类的一个方法,用于设置图形元素的可选择性。通过这个方法,我们可以定义图形元素如何响应鼠标点击事件,从而实现交互式的图形选择功能。
1.1 基本语法
set_picker()方法的基本语法如下:
artist.set_picker(picker)
其中,artist是任何Matplotlib的Artist对象(如线条、点、文本等),picker参数可以是以下几种类型:
- None:禁用选择功能
- 布尔值:True表示可选择,False表示不可选择
- 浮点数:表示选择的容差(单位为点)
- 可调用对象:自定义选择行为的函数
让我们通过一个简单的例子来说明set_picker()的基本用法:
import matplotlib.pyplot as plt

fig, ax = plt.subplots()
ax.set_title("how2matplotlib.com - Basic Picker Example")

line, = ax.plot([1, 2, 3, 4], [1, 4, 2, 3], picker=5)  # 5 points tolerance

def on_pick(event):
    thisline = event.artist
    xdata = thisline.get_xdata()
    ydata = thisline.get_ydata()
    ind = event.ind
    print(f'on pick line: {xdata[ind]}, {ydata[ind]}')

fig.canvas.mpl_connect('pick_event', on_pick)

plt.show()
Output:
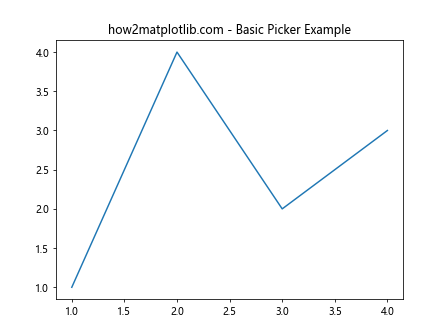
在这个例子中,我们创建了一个简单的线图,并将picker设置为5。这意味着鼠标点击距离线条5个点以内时,都会触发选择事件。我们还定义了一个on_pick函数来处理选择事件,打印出被选中点的坐标。
2. 设置不同类型的picker
2.1 使用布尔值
我们可以使用布尔值来简单地启用或禁用图形元素的可选择性:
import matplotlib.pyplot as plt

fig, ax = plt.subplots()
ax.set_title("how2matplotlib.com - Boolean Picker Example")

line1, = ax.plot([1, 2, 3, 4], [1, 4, 2, 3], label='Selectable', picker=True)
line2, = ax.plot([1, 2, 3, 4], [4, 3, 2, 1], label='Not Selectable', picker=False)

def on_pick(event):
    thisline = event.artist
    print(f'Selected line: {thisline.get_label()}')

fig.canvas.mpl_connect('pick_event', on_pick)

plt.legend()
plt.show()
Output:
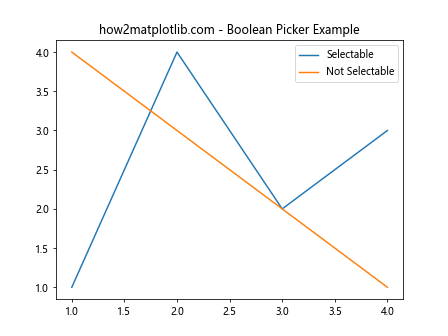
在这个例子中,我们创建了两条线,一条可选择(picker=True),另一条不可选择(picker=False)。
2.2 使用浮点数
使用浮点数作为picker值可以更精确地控制选择的容差:
import matplotlib.pyplot as plt
import numpy as np

fig, ax = plt.subplots()
ax.set_title("how2matplotlib.com - Float Picker Example")

x = np.linspace(0, 10, 100)
line, = ax.plot(x, np.sin(x), picker=0.5)  # 0.5 points tolerance

def on_pick(event):
    thisline = event.artist
    xdata = thisline.get_xdata()
    ydata = thisline.get_ydata()
    ind = event.ind
    print(f'Selected points: {list(zip(xdata[ind], ydata[ind]))}')

fig.canvas.mpl_connect('pick_event', on_pick)

plt.show()
Output:
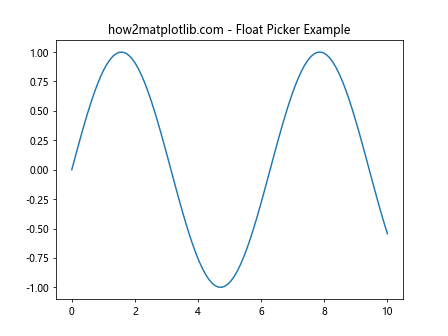
在这个例子中,我们绘制了一条正弦曲线,并将picker设置为0.5。这意味着鼠标点击距离曲线0.5个点以内时,都会触发选择事件。
2.3 使用可调用对象
使用可调用对象作为picker可以实现更复杂的选择逻辑:
import matplotlib.pyplot as plt
import numpy as np

fig, ax = plt.subplots()
ax.set_title("how2matplotlib.com - Callable Picker Example")

x = np.random.rand(100)
y = np.random.rand(100)
colors = np.random.rand(100)
sizes = 1000 * np.random.rand(100)

def picker_function(artist, mouse_event):
    if mouse_event.xdata is None:
        return False, {}
    contains, info = artist.contains(mouse_event)
    if not contains:
        return False, {}
    return True, {'index': info['ind'][0]}

scatter = ax.scatter(x, y, c=colors, s=sizes, picker=picker_function)

def on_pick(event):
    ind = event.artist.get_offsets()[event.extra['index']]
    print(f'Selected point: {ind}')

fig.canvas.mpl_connect('pick_event', on_pick)

plt.show()
Output:
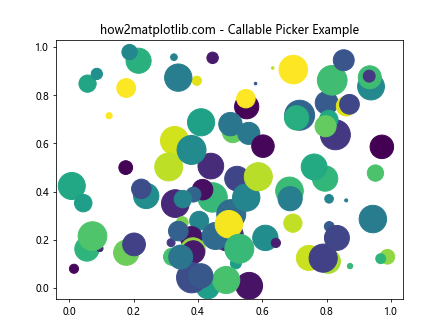
在这个例子中,我们创建了一个散点图,并定义了一个自定义的picker_function。这个函数检查鼠标事件是否在点的范围内,如果是,则返回True和选中点的索引。
3. 处理pick事件
当图形元素被选中时,Matplotlib会触发一个pick事件。我们可以通过连接到这个事件来执行自定义的操作。
3.1 基本的pick事件处理
以下是一个基本的pick事件处理示例:
import matplotlib.pyplot as plt
import numpy as np

fig, ax = plt.subplots()
ax.set_title("how2matplotlib.com - Basic Pick Event Handling")

x = np.linspace(0, 10, 100)
line, = ax.plot(x, np.sin(x), picker=5)

def on_pick(event):
    thisline = event.artist
    xdata = thisline.get_xdata()
    ydata = thisline.get_ydata()
    ind = event.ind
    print(f'Selected points: {list(zip(xdata[ind], ydata[ind]))}')

fig.canvas.mpl_connect('pick_event', on_pick)

plt.show()
Output:
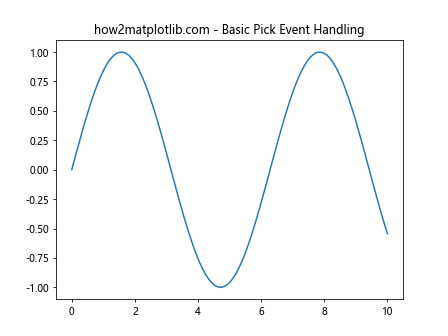
在这个例子中,当线被选中时,我们打印出被选中点的坐标。
3.2 高亮显示选中的元素
我们可以通过修改图形元素的属性来高亮显示被选中的元素:
import matplotlib.pyplot as plt
import numpy as np

fig, ax = plt.subplots()
ax.set_title("how2matplotlib.com - Highlight Selected Elements")

x = np.linspace(0, 10, 10)
y = np.sin(x)
scatter = ax.scatter(x, y, picker=True)

highlighted = None

def on_pick(event):
    global highlighted
    if highlighted is not None:
        highlighted.set_facecolors(highlighted.get_facecolors()[:1])

    ind = event.ind[0]
    highlighted = event.artist
    fc = highlighted.get_facecolors()
    fc[ind, :] = (1, 0, 0, 1)  # Red
    highlighted.set_facecolors(fc)
    fig.canvas.draw_idle()

fig.canvas.mpl_connect('pick_event', on_pick)

plt.show()
Output:
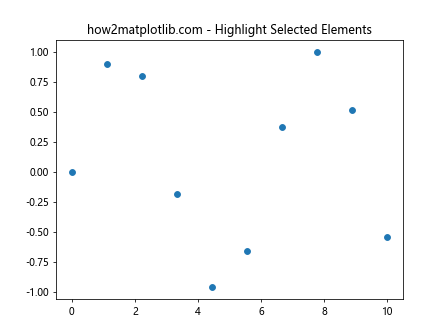
在这个例子中,我们创建了一个散点图,并在点被选中时将其颜色改为红色。
3.3 显示选中元素的信息
我们可以使用文本注释来显示选中元素的详细信息:
import matplotlib.pyplot as plt
import numpy as np

fig, ax = plt.subplots()
ax.set_title("how2matplotlib.com - Show Info of Selected Elements")

x = np.linspace(0, 10, 10)
y = np.sin(x)
scatter = ax.scatter(x, y, picker=True)

annotation = ax.annotate("", xy=(0, 0), xytext=(20, 20),
                         textcoords="offset points",
                         bbox=dict(boxstyle="round", fc="w"),
                         arrowprops=dict(arrowstyle="->"))
annotation.set_visible(False)

def on_pick(event):
    ind = event.ind[0]
    x, y = event.artist.get_offsets()[ind]
    annotation.xy = (x, y)
    annotation.set_text(f"x: {x:.2f}\ny: {y:.2f}")
    annotation.set_visible(True)
    fig.canvas.draw_idle()

fig.canvas.mpl_connect('pick_event', on_pick)

plt.show()
Output:
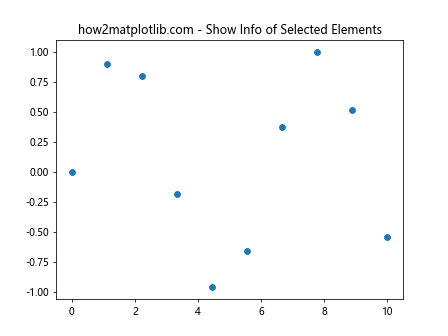
在这个例子中,当点被选中时,我们显示一个带有该点坐标信息的文本注释。
4. 高级应用
4.1 多图形元素的选择
我们可以为多个图形元素设置picker,并在同一个事件处理函数中处理它们:
import matplotlib.pyplot as plt
import numpy as np

fig, ax = plt.subplots()
ax.set_title("how2matplotlib.com - Multiple Pickable Elements")

x = np.linspace(0, 10, 100)
line1, = ax.plot(x, np.sin(x), label='sin', picker=5)
line2, = ax.plot(x, np.cos(x), label='cos', picker=5)
scatter = ax.scatter(x[::10], np.tan(x[::10]), label='tan', picker=5)

def on_pick(event):
    artist = event.artist
    if isinstance(artist, plt.Line2D):
        thisline = artist
        xdata = thisline.get_xdata()
        ydata = thisline.get_ydata()
        ind = event.ind
        print(f'Selected {thisline.get_label()} points: {list(zip(xdata[ind], ydata[ind]))}')
    elif isinstance(artist, plt.collections.PathCollection):
        ind = event.ind
        print(f'Selected scatter points: {artist.get_offsets()[ind]}')

fig.canvas.mpl_connect('pick_event', on_pick)

plt.legend()
plt.show()
Output:
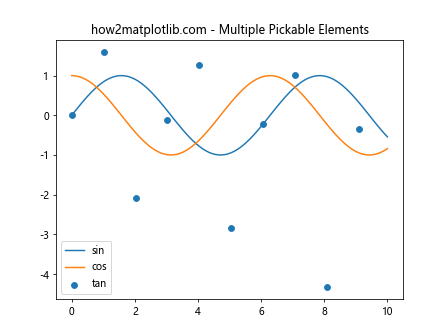
在这个例子中,我们创建了两条线和一组散点,并为它们都设置了picker。在事件处理函数中,我们根据图形元素的类型来区分处理。
4.2 自定义选择区域
我们可以使用自定义的picker函数来定义更复杂的选择区域:
import matplotlib.pyplot as plt
import numpy as np

fig, ax = plt.subplots()
ax.set_title("how2matplotlib.com - Custom Selection Area")

x = np.random.rand(100)
y = np.random.rand(100)
scatter = ax.scatter(x, y)

def ellipse_picker(artist, mouse_event):
    if mouse_event.xdata is None:
        return False, {}
    x, y = artist.get_offsets().T
    x0, y0 = mouse_event.xdata, mouse_event.ydata
    a, b = 0.1, 0.05  # Ellipse semi-major and semi-minor axes
    d = np.sqrt(((x - x0) / a) ** 2 + ((y - y0) / b) ** 2)
    ind = np.nonzero(d < 1)[0]
    if len(ind) > 0:
        return True, {'ind': ind}
    return False, {}

scatter.set_picker(ellipse_picker)

def on_pick(event):
    ind = event.ind
    print(f'Selected points: {scatter.get_offsets()[ind]}')

fig.canvas.mpl_connect('pick_event', on_pick)

plt.show()
Output:
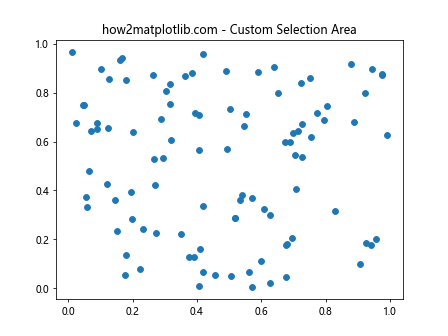
在这个例子中,我们定义了一个椭圆形的选择区域。当鼠标点击在这个椭圆区域内时,会选中该区域内的所有点。
4.3 交互式图例
我们可以使用set_picker()来创建交互式的图例,允许用户通过点击图例来显示或隐藏对应的图形元素:
import matplotlib.pyplot as plt
import numpy as np

fig, ax = plt.subplots()
ax.set_title("how2matplotlib.com - Interactive Legend")

x = np.linspace(0, 10, 100)
line1, = ax.plot(x, np.sin(x), label='sin')
line2, = ax.plot(x, np.cos(x), label='cos')
line3, = ax.plot(x, np.tan(x), label='tan')

leg = ax.legend()

for legline, origline in zip(leg.get_lines(), [line1, line2, line3]):
    legline.set_picker(5)
    origline.set_visible(False)

def on_pick(event):
    legline = event.artist
    origline = next(line for line, legline_
                    in zip([line1, line2, line3], leg.get_lines())
                    if legline_ == legline)
    visible = not origline.get_visible()
    origline.set_visible(visible)
    legline.set_alpha(1.0 if visible else 0.2)
    fig.canvas.draw()

fig.canvas.mpl_connect('pick_event', on_pick)

plt.show()
Output:
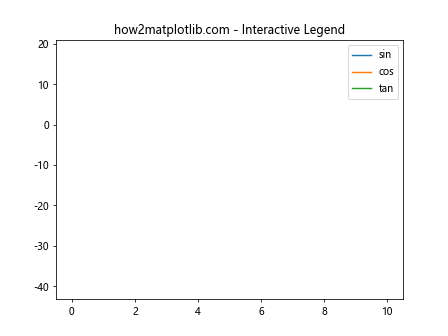
在这个例子中,我们创建了一个交互式的图例。用户可以通过点击图例中的线条来显示或隐藏对应的图形。
4.4 动态更新图形
我们可以结合set_picker()和动画功能来创建动态更新的图形:
import matplotlib.pyplot as plt
import numpy as np
from matplotlib.animation import FuncAnimation

fig, ax = plt.subplots()
ax.set_title("how2matplotlib.com - Dynamic Updating Graph")

x = np.linspace(0, 10, 100)
line, = ax.plot(x, np.sin(x), picker=5)

selected_point = None

def on_pick(event):全局变量 selected_point
    global selected_point
    thisline = event.artist
    xdata = thisline.get_xdata()
    ydata = thisline.get_ydata()
    ind = event.ind[0]
    selected_point = ind
    print(f'Selected point: ({xdata[ind]:.2f}, {ydata[ind]:.2f})')

fig.canvas.mpl_connect('pick_event', on_pick)

def update(frame):
    y = np.sin(x + frame / 10)
    line.set_ydata(y)
    if selected_point is not None:
        ax.set_title(f"how2matplotlib.com - Selected: ({x[selected_point]:.2f}, {y[selected_point]:.2f})")
    return line,

ani = FuncAnimation(fig, update, frames=100, interval=50, blit=True)

plt.show()
在这个例子中,我们创建了一个动态更新的正弦波图形。用户可以选择一个点,而图形会持续更新,显示所选点的当前坐标。
5. 实际应用场景
5.1 数据分析工具
set_picker()方法在创建交互式数据分析工具时非常有用。例如,我们可以创建一个散点图,允许用户选择感兴趣的点并显示详细信息:
import matplotlib.pyplot as plt
import numpy as np
import pandas as pd

# 创建示例数据
np.random.seed(42)
data = pd.DataFrame({
    'x': np.random.randn(100),
    'y': np.random.randn(100),
    'size': np.random.randint(100, 1000, 100),
    'category': np.random.choice(['A', 'B', 'C', 'D'], 100)
})

fig, ax = plt.subplots(figsize=(10, 8))
ax.set_title("how2matplotlib.com - Interactive Data Analysis Tool")

scatter = ax.scatter(data['x'], data['y'], s=data['size'], c=data['category'], cmap='viridis', picker=True)

annotation = ax.annotate("", xy=(0, 0), xytext=(20, 20),
                         textcoords="offset points",
                         bbox=dict(boxstyle="round", fc="w"),
                         arrowprops=dict(arrowstyle="->"))
annotation.set_visible(False)

def on_pick(event):
    ind = event.ind[0]
    x, y = data.iloc[ind][['x', 'y']]
    size = data.iloc[ind]['size']
    category = data.iloc[ind]['category']

    annotation.xy = (x, y)
    annotation.set_text(f"x: {x:.2f}\ny: {y:.2f}\nsize: {size}\ncategory: {category}")
    annotation.set_visible(True)
    fig.canvas.draw_idle()

fig.canvas.mpl_connect('pick_event', on_pick)

plt.colorbar(scatter, label='Category')
plt.xlabel('X')
plt.ylabel('Y')
plt.show()
这个例子创建了一个交互式散点图,用户可以点击任何点来查看其详细信息。
5.2 时间序列数据浏览器
set_picker()也可以用于创建时间序列数据浏览器,允许用户选择特定的时间点并查看详细信息:
import matplotlib.pyplot as plt
import numpy as np
import pandas as pd

# 创建示例时间序列数据
dates = pd.date_range(start='2023-01-01', end='2023-12-31', freq='D')
values = np.cumsum(np.random.randn(len(dates)))
data = pd.DataFrame({'date': dates, 'value': values})

fig, ax = plt.subplots(figsize=(12, 6))
ax.set_title("how2matplotlib.com - Time Series Data Browser")

line, = ax.plot(data['date'], data['value'], picker=5)

annotation = ax.annotate("", xy=(0, 0), xytext=(20, 20),
                         textcoords="offset points",
                         bbox=dict(boxstyle="round", fc="w"),
                         arrowprops=dict(arrowstyle="->"))
annotation.set_visible(False)

def on_pick(event):
    ind = event.ind[0]
    date = data.iloc[ind]['date']
    value = data.iloc[ind]['value']

    annotation.xy = (date, value)
    annotation.set_text(f"Date: {date.strftime('%Y-%m-%d')}\nValue: {value:.2f}")
    annotation.set_visible(True)
    fig.canvas.draw_idle()

fig.canvas.mpl_connect('pick_event', on_pick)

plt.xlabel('Date')
plt.ylabel('Value')
plt.xticks(rotation=45)
plt.tight_layout()
plt.show()
Output:
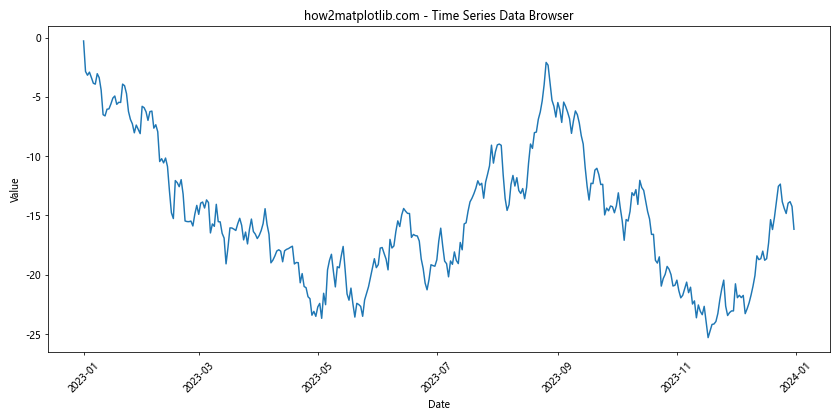
这个例子创建了一个时间序列数据浏览器,用户可以点击线上的任何点来查看该日期的具体数值。
5.3 交互式地图
set_picker()还可以用于创建交互式地图,允许用户选择特定的地点并查看相关信息:
import matplotlib.pyplot as plt
import numpy as np

# 创建示例地图数据
np.random.seed(42)
cities = ['New York', 'Los Angeles', 'Chicago', 'Houston', 'Phoenix']
lats = np.random.uniform(25, 48, 5)
lons = np.random.uniform(-123, -71, 5)
populations = np.random.randint(1000000, 10000000, 5)

fig, ax = plt.subplots(figsize=(12, 8))
ax.set_title("how2matplotlib.com - Interactive Map")

scatter = ax.scatter(lons, lats, s=populations/50000, alpha=0.5, picker=True)

annotation = ax.annotate("", xy=(0, 0), xytext=(20, 20),
                         textcoords="offset points",
                         bbox=dict(boxstyle="round", fc="w"),
                         arrowprops=dict(arrowstyle="->"))
annotation.set_visible(False)

def on_pick(event):
    ind = event.ind[0]
    city = cities[ind]
    lat, lon = lats[ind], lons[ind]
    population = populations[ind]

    annotation.xy = (lon, lat)
    annotation.set_text(f"City: {city}\nLat: {lat:.2f}\nLon: {lon:.2f}\nPopulation: {population:,}")
    annotation.set_visible(True)
    fig.canvas.draw_idle()

fig.canvas.mpl_connect('pick_event', on_pick)

plt.xlabel('Longitude')
plt.ylabel('Latitude')
plt.show()
Output:
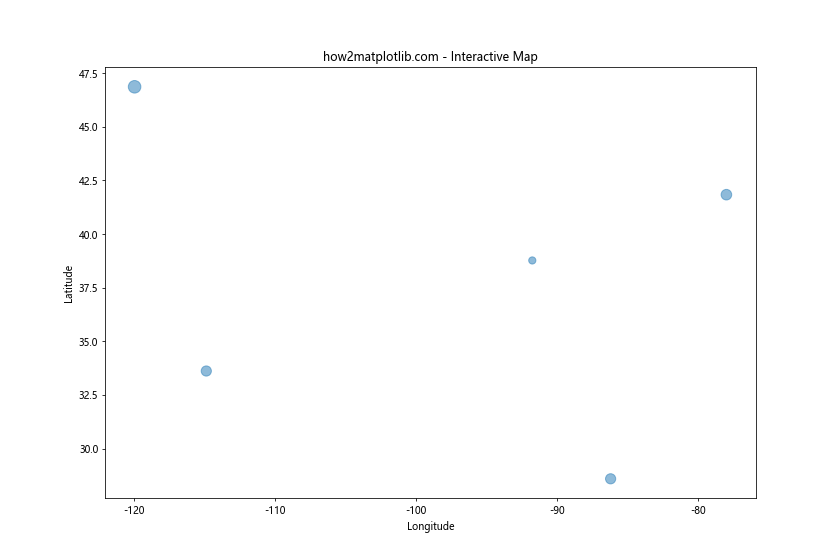
这个例子创建了一个简单的交互式地图,用户可以点击任何城市来查看其详细信息。
6. 性能考虑
在使用set_picker()时,需要考虑性能问题,特别是当处理大量数据或复杂图形时。以下是一些提高性能的建议:
- 使用适当的容差值:设置一个合适的picker容差值可以减少不必要的事件触发。
-
优化事件处理函数:确保事件处理函数尽可能高效,避免在其中进行耗时的操作。
-
使用blitting技术:在更新图形时,使用blitting可以显著提高性能。
-
考虑使用其他交互式工具:对于非常大的数据集,可以考虑使用专门的交互式可视化库,如Bokeh或Plotly。
7. 常见问题和解决方案
使用set_picker()时可能遇到的一些常见问题及其解决方案:
- 问题:选择事件不触发
解决方案:确保正确连接了事件处理函数,并检查picker值是否合适。 -
问题:选择多个重叠元素
解决方案:在事件处理函数中处理多个选择,或使用自定义picker函数来定义选择优先级。 -
问题:性能问题
解决方案:优化代码,使用更高效的数据结构,考虑使用缓存或延迟加载技术。 -
问题:与其他交互功能冲突
解决方案:仔细管理不同的交互功能,可能需要禁用某些默认的交互行为。
8. 总结
Matplotlib的Artist.set_picker()方法是一个强大的工具,可以大大增强数据可视化的交互性。通过本文的详细介绍和丰富的示例,我们了解了如何使用set_picker()来实现各种交互式图形选择功能。从基本的点击选择到复杂的自定义选择区域,从简单的信息显示到动态更新的图形,set_picker()为创建丰富的交互式数据可视化提供了无限可能。
在实际应用中,set_picker()可以用于创建各种交互式工具,如数据分析工具、时间序列浏览器和交互式地图等。通过结合其他Matplotlib功能和Python的数据处理能力,我们可以创建出功能强大、用户友好的数据可视化应用。
然而,在使用set_picker()时也需要注意性能问题,特别是在处理大量数据时。通过优化代码、使用适当的技术和考虑替代方案,我们可以创建出既交互又高效的可视化。
总的来说,掌握Artist.set_picker()方法可以让我们的Matplotlib图形更加生动、交互,为用户提供更好的数据探索和分析体验。随着数据可视化在各个领域的重要性不断增加,这种交互式可视化技术将变得越来越重要。
 极客教程
极客教程