Matplotlib中的Artist.remove()方法:轻松移除图形元素
参考:Matplotlib.artist.Artist.remove() in Python
Matplotlib是Python中最流行的数据可视化库之一,它提供了丰富的绘图功能和灵活的自定义选项。在Matplotlib中,几乎所有可见的元素都是Artist对象,包括Figure、Axes以及线条、文本、标记等。Artist类是所有这些可视元素的基类,它提供了许多通用方法来操作这些元素。其中,remove()方法是一个非常有用的工具,它允许我们从图形中动态地移除不需要的元素。本文将深入探讨Matplotlib中的Artist.remove()方法,介绍其用法、应用场景以及注意事项。
1. Artist.remove()方法简介
Artist.remove()是Matplotlib中Artist类的一个方法,用于从图形中移除特定的艺术家对象(Artist object)。这个方法非常简单直观,但却非常强大,因为它允许我们在绘图过程中动态地调整图形内容。
基本语法
artist.remove()
其中,artist是任何Artist对象的实例,如Line2D、Text、Rectangle等。
示例代码
让我们从一个简单的例子开始,展示如何使用remove()方法:
import matplotlib.pyplot as plt

# 创建一个简单的图形
fig, ax = plt.subplots()
line, = ax.plot([1, 2, 3, 4], [1, 4, 2, 3], label='how2matplotlib.com')
ax.set_title('Before removing the line')

# 显示图形
plt.show()

# 移除线条
line.remove()
ax.set_title('After removing the line')

# 重新显示图形
plt.show()
在这个例子中,我们首先创建了一个简单的线图,然后使用line.remove()方法移除了这条线。注意,我们需要再次调用plt.show()来显示更新后的图形。
2. 移除不同类型的Artist对象
Artist.remove()方法可以用于移除各种类型的Artist对象,包括但不限于:
- 线条(Line2D)
- 文本(Text)
- 标记(Marker)
- 矩形(Rectangle)
- 圆形(Circle)
- 多边形(Polygon)
- 图例(Legend)
让我们通过一系列示例来展示如何移除这些不同类型的对象。
2.1 移除线条
import matplotlib.pyplot as plt

fig, ax = plt.subplots()
line1, = ax.plot([1, 2, 3, 4], [1, 4, 2, 3], label='Line 1')
line2, = ax.plot([1, 2, 3, 4], [2, 3, 4, 1], label='Line 2')
ax.set_title('how2matplotlib.com - Before removing Line 1')
plt.legend()

plt.show()

# 移除 line1
line1.remove()
ax.set_title('After removing Line 1')

plt.show()
在这个例子中,我们创建了两条线,然后移除了其中一条。注意,我们需要使用逗号来解包ax.plot()返回的元组,以获取Line2D对象。
2.2 移除文本
import matplotlib.pyplot as plt

fig, ax = plt.subplots()
ax.plot([1, 2, 3, 4], [1, 4, 2, 3])
text = ax.text(2, 3, 'how2matplotlib.com', fontsize=12)
ax.set_title('Before removing the text')

plt.show()

# 移除文本
text.remove()
ax.set_title('After removing the text')

plt.show()
这个例子展示了如何添加文本到图形中,然后使用remove()方法移除它。
2.3 移除标记
import matplotlib.pyplot as plt

fig, ax = plt.subplots()
scatter = ax.scatter([1, 2, 3, 4], [1, 4, 2, 3], s=100, c='red', label='how2matplotlib.com')
ax.set_title('Before removing the scatter points')

plt.show()

# 移除散点图
scatter.remove()
ax.set_title('After removing the scatter points')

plt.show()
这个例子展示了如何创建散点图,然后使用remove()方法移除所有的散点。
2.4 移除矩形
import matplotlib.pyplot as plt

fig, ax = plt.subplots()
rect = plt.Rectangle((0.2, 0.2), 0.6, 0.6, fill=False, label='how2matplotlib.com')
ax.add_patch(rect)
ax.set_title('Before removing the rectangle')

plt.show()

# 移除矩形
rect.remove()
ax.set_title('After removing the rectangle')

plt.show()
这个例子展示了如何添加矩形到图形中,然后使用remove()方法移除它。
2.5 移除圆形
import matplotlib.pyplot as plt

fig, ax = plt.subplots()
circle = plt.Circle((0.5, 0.5), 0.2, fill=False, label='how2matplotlib.com')
ax.add_patch(circle)
ax.set_title('Before removing the circle')
ax.set_xlim(0, 1)
ax.set_ylim(0, 1)

plt.show()

# 移除圆形
circle.remove()
ax.set_title('After removing the circle')

plt.show()
这个例子展示了如何添加圆形到图形中,然后使用remove()方法移除它。
2.6 移除多边形
import matplotlib.pyplot as plt
import numpy as np

fig, ax = plt.subplots()
polygon = plt.Polygon(np.array([[0.2, 0.2], [0.8, 0.2], [0.5, 0.8]]), fill=False, label='how2matplotlib.com')
ax.add_patch(polygon)
ax.set_title('Before removing the polygon')
ax.set_xlim(0, 1)
ax.set_ylim(0, 1)

plt.show()

# 移除多边形
polygon.remove()
ax.set_title('After removing the polygon')

plt.show()
这个例子展示了如何添加多边形到图形中,然后使用remove()方法移除它。
2.7 移除图例
import matplotlib.pyplot as plt

fig, ax = plt.subplots()
ax.plot([1, 2, 3, 4], [1, 4, 2, 3], label='how2matplotlib.com')
legend = ax.legend()
ax.set_title('Before removing the legend')

plt.show()

# 移除图例
legend.remove()
ax.set_title('After removing the legend')

plt.show()
这个例子展示了如何添加图例到图形中,然后使用remove()方法移除它。
3. 动态更新图形
Artist.remove()方法的一个重要应用是动态更新图形。在某些情况下,我们可能需要根据用户输入或数据变化来实时调整图形内容。以下是一些常见的动态更新场景:
3.1 交互式移除元素
import matplotlib.pyplot as plt

fig, ax = plt.subplots()
lines = []
for i in range(3):
    line, = ax.plot([1, 2, 3, 4], [i+1, i+4, i+2, i+3], label=f'Line {i+1}')
    lines.append(line)

ax.set_title('how2matplotlib.com - Click on legend to remove lines')
ax.legend()

def on_pick(event):
    legend = event.artist
    name = legend.get_text()
    for line in lines:
        if line.get_label() == name:
            line.remove()
            legend.remove()
    fig.canvas.draw()

fig.canvas.mpl_connect('pick_event', on_pick)
plt.legend(loc='center left', bbox_to_anchor=(1, 0.5)).set_picker(True)

plt.show()
Output:
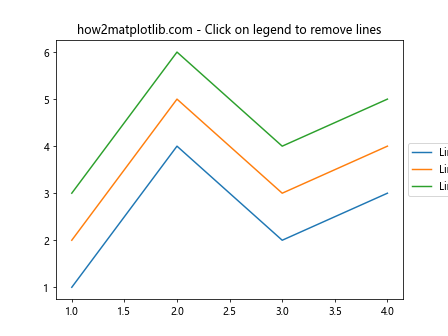
这个例子创建了一个交互式图形,用户可以通过点击图例来移除相应的线条。
3.2 动态添加和移除元素
import matplotlib.pyplot as plt
import numpy as np

fig, ax = plt.subplots()
ax.set_xlim(0, 10)
ax.set_ylim(0, 10)

lines = []

def add_line():
    x = np.random.rand(2) * 10
    y = np.random.rand(2) * 10
    line, = ax.plot(x, y, label=f'Line {len(lines)+1}')
    lines.append(line)
    ax.legend()
    fig.canvas.draw()

def remove_line():
    if lines:
        line = lines.pop()
        line.remove()
        ax.legend()
        fig.canvas.draw()

ax.set_title('how2matplotlib.com - Dynamic Line Addition/Removal')

add_button_ax = plt.axes([0.7, 0.05, 0.1, 0.075])
add_button = plt.Button(add_button_ax, 'Add')
add_button.on_clicked(lambda event: add_line())

remove_button_ax = plt.axes([0.81, 0.05, 0.1, 0.075])
remove_button = plt.Button(remove_button_ax, 'Remove')
remove_button.on_clicked(lambda event: remove_line())

plt.show()
Output:
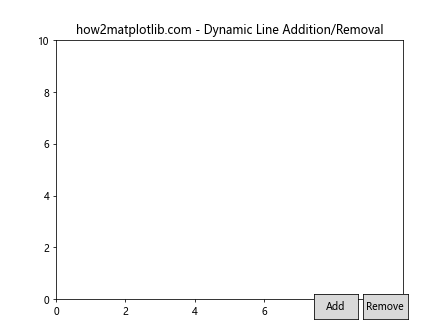
这个例子创建了一个动态图形,用户可以通过按钮来添加或移除线条。
4. 注意事项和最佳实践
在使用Artist.remove()方法时,有一些注意事项和最佳实践需要牢记:
4.1 更新图形
调用remove()方法后,图形不会自动更新。你需要手动调用plt.draw()或fig.canvas.draw()来刷新图形。
import matplotlib.pyplot as plt

fig, ax = plt.subplots()
line, = ax.plot([1, 2, 3, 4], [1, 4, 2, 3], label='how2matplotlib.com')
ax.set_title('Before removing the line')

plt.show(block=False)

# 移除线条并立即更新图形
line.remove()
ax.set_title('After removing the line')
fig.canvas.draw()

plt.show()
Output:
4.2 保持对Artist对象的引用
为了能够移除特定的Artist对象,你需要保持对该对象的引用。
import matplotlib.pyplot as plt

fig, ax = plt.subplots()
artists = []

for i in range(5):
    artist, = ax.plot([1, 2, 3, 4], [i, i+1, i+2, i+3], label=f'Line {i+1}')
    artists.append(artist)

ax.set_title('how2matplotlib.com - Multiple lines')
ax.legend()

plt.show()

# 移除第三条线
artists[2].remove()
ax.set_title('After removing the third line')
ax.legend()

plt.show()
4.3 处理图例
当你移除一个带有标签的Artist对象时,相应的图例条目不会自动更新。你需要手动重新创建图例。
import matplotlib.pyplot as plt

fig, ax = plt.subplots()
line1, = ax.plot([1, 2, 3, 4], [1, 4, 2, 3], label='Line 1')
line2, = ax.plot([1, 2, 3, 4], [2, 3, 4, 1], label='Line 2')
ax.set_title('how2matplotlib.com - Before removing Line 1')
ax.legend()

plt.show()

# 移除 line1 并更新图例
line1.remove()
ax.set_title('After removing Line 1')
ax.legend()

plt.show()
4.4 移除复合对象
某些Artist对象可能包含多个子对象。在这种情况下,你可能需要分别移除每个子对象。
import matplotlib.pyplot as plt

fig, ax = plt.subplots()
x = [1, 2, 3, 4]
y = [1, 4, 2, 3]
scatter = ax.scatter(x, y, s=100, c='red', label='how2matplotlib.com')
errorbar = ax.errorbar(x, y, yerr=0.5, fmt='none', capsize=5)

ax.set_title('Before removing errorbar')
plt.show()

# 移除误差线
for line in errorbar.lines:
    line.remove()
for cap in errorbar.caps:
    cap.remove()

ax.set_title('After removing errorbar')
plt.show()
5. 高级应用
Artist.remove()方法不仅可以用于简单的元素移除,还可以在更复杂的场景中发挥作用。以下是一些高级应用示例:
5.1 动画效果
通过定期添加和移除元素,我们可以创建简单的动画效果。
import matplotlib.pyplot as plt
import numpy as np
from matplotlib.animation import FuncAnimation

fig, ax = plt.subplots()
ax.set_xlim(0, 10)
ax.set_ylim(0, 10)
line, = ax.plot([], [], 'ro-')

def init():
    line.set_data([], [])
    return line,

def update(frame):
    x = np.linspace(0, 10, 100)
    y = np.sin(x + frame / 10) * 4 + 5
    line.set_data(x, y)

    # 添加和移除文本
    if hasattr(update, 'text'):
        update.text.remove()
    update.text = ax.text(5, 9, f'Frame: {frame}', ha='center')

    return line, update.text

ani = FuncAnimation(fig, update, frames=100, init_func=init, blit=True, interval=50)

ax.set_title('how2matplotlib.com - Animated Sine Wave')
plt.show()
Output:
这个例子展示了如何创建一个简单的正弦波动画,同时动态更新帧数文本。
5.2 交互式数据探索
Artist.remove()方法可以用于创建交互式数据探索工具,允许用户动态地添加或移除数据系列。
import matplotlib.pyplot as plt
import numpy as np
from matplotlib.widgets import CheckButtons

fig, ax = plt.subplots()
t = np.arange(0.0, 2.0, 0.01)
s1 = np.sin(2*np.pi*t)
s2 = np.cos(2*np.pi*t)
s3 = np.sin(4*np.pi*t)

l1, = ax.plot(t, s1, lw=2, color='red', label='sin')
l2, = ax.plot(t, s2, lw=2, color='blue', label='cos')
l3, = ax.plot(t, s3, lw=2, color='green', label='sin2')

plt.subplots_adjust(left=0.2)
lines = [l1, l2, l3]

# 创建复选框
rax = plt.axes([0.05, 0.4, 0.1, 0.15])
labels = [str(line.get_label()) for line in lines]
visibility = [line.get_visible() for line in lines]
check = CheckButtons(rax, labels, visibility)

def func(label):
    index = labels.index(label)
    lines[index].set_visible(not lines[index].get_visible())
    plt.draw()

check.on_clicked(func)

ax.set_title('how2matplotlib.com - Interactive Data Exploration')
plt.show()
Output:
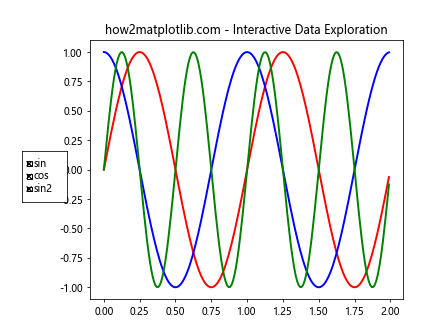
这个例子创建了一个带有复选框的交互式图形,用户可以通过勾选或取消勾选来显示或隐藏不同的数据系列。
5.3 实时数据可视化
在实时数据可视化中,Artist.remove()方法可以用于移除旧数据点,保持图形的整洁和高效。
import matplotlib.pyplot as plt
import numpy as np
from matplotlib.animation import FuncAnimation

fig, ax = plt.subplots()
ax.set_xlim(0, 50)
ax.set_ylim(-1, 1)
line, = ax.plot([], [])

def update(frame):
    x = np.linspace(0, 50, 100)
    y = np.sin(x + frame / 10)
    line.set_data(x, y)

    # 添加新的散点
    scatter = ax.scatter(frame % 50, np.sin(frame / 10), color='red')

    # 移除旧的散点
    if frame > 50:
        old_scatter = ax.collections[0]
        old_scatter.remove()

    ax.set_title(f'how2matplotlib.com - Frame: {frame}')
    return line, scatter

ani = FuncAnimation(fig, update, frames=200, interval=50, blit=True)
plt.show()
Output:
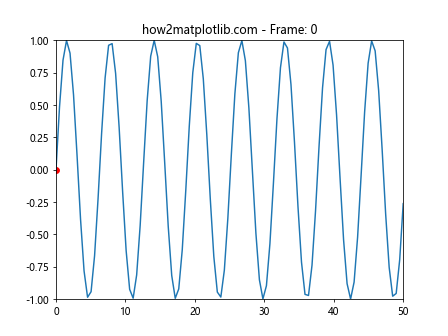
这个例子展示了如何创建一个实时更新的正弦波图形,同时添加新的散点并移除旧的散点。
6. 性能考虑
虽然Artist.remove()方法非常有用,但在处理大量对象或频繁更新时,可能会影响性能。以下是一些优化建议:
6.1 批量移除
如果需要移除多个对象,考虑使用列表推导式或循环来批量移除,而不是多次调用remove()方法。
import matplotlib.pyplot as plt
import numpy as np

fig, ax = plt.subplots()
lines = [ax.plot(np.random.rand(10), label=f'Line {i}')[0] for i in range(100)]
ax.legend()
ax.set_title('how2matplotlib.com - Before removing lines')

plt.show()

# 批量移除偶数索引的线
[line.remove() for i, line in enumerate(lines) if i % 2 == 0]
ax.legend()
ax.set_title('After removing even-indexed lines')

plt.show()
6.2 使用blitting技术
对于动画或实时更新的图形,使用blitting技术可以显著提高性能。
import matplotlib.pyplot as plt
import numpy as np
from matplotlib.animation import FuncAnimation

fig, ax = plt.subplots()
ax.set_xlim(0, 2*np.pi)
ax.set_ylim(-1, 1)
line, = ax.plot([], [])

def init():
    line.set_data([], [])
    return line,

def update(frame):
    x = np.linspace(0, 2*np.pi, 100)
    y = np.sin(x + frame / 10)
    line.set_data(x, y)
    ax.set_title(f'how2matplotlib.com - Frame: {frame}')
    return line,

ani = FuncAnimation(fig, update, frames=100, init_func=init, blit=True, interval=50)
plt.show()
Output:
这个例子使用了blitting技术来优化动画性能。
7. 常见问题和解决方案
在使用Artist.remove()方法时,可能会遇到一些常见问题。以下是一些问题及其解决方案:
7.1 移除对象后图形没有更新
问题:调用remove()方法后,图形没有立即更新。
解决方案:手动调用plt.draw()或fig.canvas.draw()来刷新图形。
import matplotlib.pyplot as plt

fig, ax = plt.subplots()
line, = ax.plot([1, 2, 3, 4], [1, 4, 2, 3], label='how2matplotlib.com')
ax.set_title('Before removing the line')

plt.show(block=False)

# 移除线条并立即更新图形
line.remove()
ax.set_title('After removing the line')
fig.canvas.draw()

plt.show()
Output:
7.2 移除对象后图例仍然存在
问题:移除带有标签的对象后,图例中仍然显示该对象。
解决方案:重新创建图例或使用ax.legend()更新图例。
import matplotlib.pyplot as plt

fig, ax = plt.subplots()
line1, = ax.plot([1, 2, 3, 4], [1, 4, 2, 3], label='Line 1')
line2, = ax.plot([1, 2, 3, 4], [2, 3, 4, 1], label='Line 2')
ax.legend()
ax.set_title('how2matplotlib.com - Before removing Line 1')

plt.show()

# 移除 line1 并更新图例
line1.remove()
ax.legend()
ax.set_title('After removing Line 1')

plt.show()
7.3 无法移除某些复合对象
问题:某些复合对象(如误差线)无法通过单个remove()调用完全移除。
解决方案:分别移除复合对象的各个组成部分。
import matplotlib.pyplot as plt

fig, ax = plt.subplots()
x = [1, 2, 3, 4]
y = [1, 4, 2, 3]
errorbar = ax.errorbar(x, y, yerr=0.5, fmt='o', capsize=5, label='how2matplotlib.com')
ax.set_title('Before removing errorbar')

plt.show()

# 移除误差线的所有组成部分
for line in errorbar.lines:
    line.remove()
for cap in errorbar.caps:
    cap.remove()
errorbar[0].remove()  # 移除数据点

ax.set_title('After removing errorbar')
plt.show()
8. 总结
Matplotlib的Artist.remove()方法是一个强大而灵活的工具,允许我们动态地管理图形中的元素。通过本文的详细介绍和丰富的示例,我们了解了如何使用这个方法来移除各种类型的图形元素,如何在动态和交互式场景中应用它,以及如何处理一些常见的问题和性能考虑。
掌握Artist.remove()方法可以帮助我们创建更加动态和交互式的数据可视化,使我们的图形不仅能够展示数据,还能够响应用户的操作和实时数据的变化。无论是创建简单的静态图表,还是复杂的交互式数据探索工具,Artist.remove()方法都是一个不可或缺的工具。
在实际应用中,请记住及时更新图形、正确处理图例、注意性能优化,并灵活运用本文提供的技巧和最佳实践。通过不断练习和实验,你将能够充分发挥Matplotlib的潜力,创造出更加丰富和有吸引力的数据可视化作品。
 极客教程
极客教程